Western Union 2012 Annual Report Download - page 138
Download and view the complete annual report
Please find page 138 of the 2012 Western Union annual report below. You can navigate through the pages in the report by either clicking on the pages listed below, or by using the keyword search tool below to find specific information within the annual report.-
 1
1 -
2
-
3
-
4
-
5
-
6
-
7
-
8
-
9
-
10
-
11
-
12
-
13
-
14
-
15
-
16
-
17
-
18
-
19
-
20
-
21
-
22
-
23
-
24
-
25
-
26
-
27
-
28
-
29
-
30
-
31
-
32
-
33
-
34
-
35
-
36
-
37
-
38
-
39
-
40
-
41
-
42
-
43
-
44
-
45
-
46
-
47
-
48
-
49
-
50
-
51
-
52
-
53
-
54
-
55
-
56
-
57
-
58
-
59
-
60
-
61
-
62
-
63
-
64
-
65
-
66
-
67
-
68
-
69
-
70
-
71
-
72
-
73
-
74
-
75
-
76
-
77
-
78
-
79
-
80
-
81
-
82
-
83
-
84
-
85
-
86
-
87
-
88
-
89
-
90
-
91
-
92
-
93
-
94
-
95
-
96
-
97
-
98
-
99
-
100
-
101
-
102
-
103
-
104
-
105
-
106
-
107
-
108
-
109
-
110
-
111
-
112
-
113
-
114
-
115
-
116
-
117
-
118
-
119
-
120
-
121
-
122
-
123
-
124
-
125
-
126
-
127
-
 128
128 -
 129
129 -
 130
130 -
 131
131 -
 132
132 -
 133
133 -
 134
134 -
 135
135 -
 136
136 -
 137
137 -
 138
138 -
 139
139 -
 140
140 -
 141
141 -
 142
142 -
 143
143 -
 144
144 -
 145
145 -
 146
146 -
 147
147 -
 148
148 -
149
-
150
-
151
-
152
-
153
-
154
-
155
-
156
-
157
-
158
 |
 |

THE WESTERN UNION COMPANY
NOTES TO CONSOLIDATED FINANCIAL STATEMENTS (Continued)
133
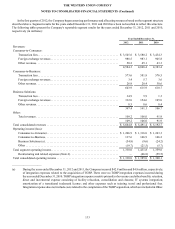
In the first quarter of 2012, the Company began assessing performance and allocating resources based on the segment structure
described above. Segment results for the years ended December 31, 2011 and 2010 have been reclassified to reflect this structure.
The following tables present the Company's reportable segment results for the years ended December 31, 2012, 2011 and 2010,
respectively (in millions):
Year Ended December 31,
2012 2011 2010
Revenues:
Consumer-to-Consumer:
Transaction fees. . . . . . . . . . . . . . . . . . . . . . . . . . . . . . . . . . . . . . . . . . . . . . . . . . . . . . . $ 3,545.6 $ 3,580.2 $ 3,434.3
Foreign exchange revenues . . . . . . . . . . . . . . . . . . . . . . . . . . . . . . . . . . . . . . . . . . . . . . 988.5 983.1 905.8
Other revenues. . . . . . . . . . . . . . . . . . . . . . . . . . . . . . . . . . . . . . . . . . . . . . . . . . . . . . . . 50.2 45.1 43.3
4,584.3 4,608.4 4,383.4
Consumer-to-Business:
Transaction fees. . . . . . . . . . . . . . . . . . . . . . . . . . . . . . . . . . . . . . . . . . . . . . . . . . . . . . . 573.6 581.8 576.5
Foreign exchange revenues . . . . . . . . . . . . . . . . . . . . . . . . . . . . . . . . . . . . . . . . . . . . . . 3.4 5.7 3.6
Other revenues. . . . . . . . . . . . . . . . . . . . . . . . . . . . . . . . . . . . . . . . . . . . . . . . . . . . . . . . 26.9 28.4 30.6
603.9 615.9 610.7
Business Solutions:
Transaction fees. . . . . . . . . . . . . . . . . . . . . . . . . . . . . . . . . . . . . . . . . . . . . . . . . . . . . . . 34.9 5.9 1.3
Foreign exchange revenues . . . . . . . . . . . . . . . . . . . . . . . . . . . . . . . . . . . . . . . . . . . . . . 332.0 154.6 105.0
Other revenues. . . . . . . . . . . . . . . . . . . . . . . . . . . . . . . . . . . . . . . . . . . . . . . . . . . . . . . . 0.5 0.6 0.4
367.4 161.1 106.7
Other:
Total revenues . . . . . . . . . . . . . . . . . . . . . . . . . . . . . . . . . . . . . . . . . . . . . . . . . . . . . . . . 109.2 106.0 91.9
109.2 106.0 91.9
Total consolidated revenues . . . . . . . . . . . . . . . . . . . . . . . . . . . . . . . . . . . . . . . . . . . . . . . . . $ 5,664.8 $ 5,491.4 $ 5,192.7
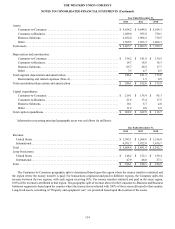
Operating income/(loss):
Consumer-to-Consumer. . . . . . . . . . . . . . . . . . . . . . . . . . . . . . . . . . . . . . . . . . . . . . . . . $ 1,266.9 $ 1,316.0 $ 1,243.3
Consumer-to-Business. . . . . . . . . . . . . . . . . . . . . . . . . . . . . . . . . . . . . . . . . . . . . . . . . . 137.6 146.9 146.2
Business Solutions (a) . . . . . . . . . . . . . . . . . . . . . . . . . . . . . . . . . . . . . . . . . . . . . . . . . . (54.8)(9.6)(24.2)
Other . . . . . . . . . . . . . . . . . . . . . . . . . . . . . . . . . . . . . . . . . . . . . . . . . . . . . . . . . . . . . . . (19.7)(21.5)(5.7)
Total segment operating income. . . . . . . . . . . . . . . . . . . . . . . . . . . . . . . . . . . . . . . . . . . . . . 1,330.0 1,431.8 1,359.6
Restructuring and related expenses (Note 4). . . . . . . . . . . . . . . . . . . . . . . . . . . . . . . . . — (46.8)(59.5)
Total consolidated operating income . . . . . . . . . . . . . . . . . . . . . . . . . . . . . . . . . . . . . . . . . . $ 1,330.0 $ 1,385.0 $ 1,300.1
____________________
(a) During the years ended December 31, 2012 and 2011, the Company incurred $42.8 million and $4.8 million, respectively,
of integration expenses related to the acquisition of TGBP. There were no TGBP integration expenses incurred during
the year ended December 31, 2010. TGBP integration expense consists primarily of severance and other benefits, retention,
direct and incremental expense consisting of facility relocation, consolidation and closures; IT systems integration;
amortization of a transitional trademark license; and other expenses such as training, travel and professional fees.
Integration expense does not include costs related to the completion of the TGBP acquisition, which are included in Other.