Western Union 2012 Annual Report Download - page 59
Download and view the complete annual report
Please find page 59 of the 2012 Western Union annual report below. You can navigate through the pages in the report by either clicking on the pages listed below, or by using the keyword search tool below to find specific information within the annual report.-
 1
1 -
2
-
3
-
4
-
5
-
6
-
7
-
8
-
9
-
10
-
11
-
12
-
13
-
14
-
15
-
16
-
17
-
18
-
19
-
20
-
21
-
22
-
23
-
24
-
25
-
26
-
27
-
28
-
29
-
30
-
31
-
32
-
33
-
34
-
35
-
36
-
37
-
38
-
39
-
40
-
41
-
42
-
43
-
44
-
45
-
46
-
47
-
48
-
 49
49 -
 50
50 -
 51
51 -
 52
52 -
 53
53 -
 54
54 -
 55
55 -
 56
56 -
 57
57 -
 58
58 -
 59
59 -
 60
60 -
 61
61 -
 62
62 -
 63
63 -
 64
64 -
 65
65 -
 66
66 -
 67
67 -
 68
68 -
 69
69 -
70
-
71
-
72
-
73
-
74
-
75
-
76
-
77
-
78
-
79
-
80
-
81
-
82
-
83
-
84
-
85
-
86
-
87
-
88
-
89
-
90
-
91
-
92
-
93
-
94
-
95
-
96
-
97
-
98
-
99
-
100
-
101
-
102
-
103
-
104
-
105
-
106
-
107
-
108
-
109
-
110
-
111
-
112
-
113
-
114
-
115
-
116
-
117
-
118
-
119
-
120
-
121
-
122
-
123
-
124
-
125
-
126
-
127
-
128
-
129
-
130
-
131
-
132
-
133
-
134
-
135
-
136
-
137
-
138
-
139
-
140
-
141
-
142
-
143
-
144
-
145
-
146
-
147
-
148
-
149
-
150
-
151
-
152
-
153
-
154
-
155
-
156
-
157
-
158
 |
 |
54
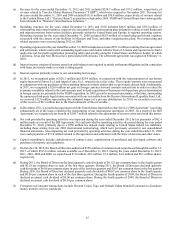
Fluctuations in the exchange rate between the United States dollar and currencies other than the United States dollar have
resulted in a reduction to transaction fees and foreign exchange revenues for the year ended December 31, 2012 of $93.8 million
over the previous year, net of foreign currency hedges, that would not have occurred had there been constant currency rates.
2011 compared to 2010
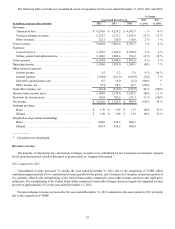
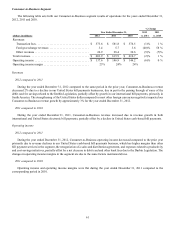
Consolidated revenue increased 6% during the year ended December 31, 2011 due to Consumer-to-Consumer transaction
growth and the weakening of the United States dollar compared to most other foreign currencies, which positively impacted
revenue, offset by slight price reductions. The weakening of the United States dollar compared to most other foreign currencies
positively impacted revenue growth by approximately 1% in the year ended December 31, 2011. The acquisition of TGBP
contributed approximately 1% to consolidated revenue growth for the year ended December 31, 2011.
Foreign exchange revenues increased for the year ended December 31, 2011 compared to the same period in 2010 primarily
due to increasing foreign exchange revenues in our Consumer-to-Consumer segment, driven primarily by the increased amount
of cross-border principal sent. Additionally, foreign exchange revenues were positively impacted by the acquisition of TGBP and
revenue growth experienced in our existing Business Solutions business.
Fluctuations in the exchange rate between the United States dollar and currencies other than the United States dollar resulted
in a benefit to transaction fees and foreign exchange revenues for the year ended December 31, 2011 of $38.0 million over the
previous year, net of foreign currency hedges, that would not have occurred had there been constant currency rates.
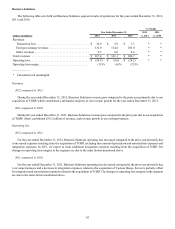
Operating expenses overview
TGBP integration expenses
During the years ended December 31, 2012 and 2011, we incurred $42.8 million and $4.8 million, respectively, of integration
expenses related to the acquisition of TGBP. TGBP was acquired on November 7, 2011. TGBP integration expense consists
primarily of severance and other benefits, retention, direct and incremental expense consisting of facility relocation, consolidation
and closures; IT systems integration; amortization of a transitional trademark license; and other expenses such as training, travel
and professional fees. Integration expense does not include costs related to the completion of the TGBP acquisition. In 2013, we
expect to incur additional integration expenses resulting from the acquisition of TGBP.
Restructuring and related activities
On May 25, 2010 and as subsequently revised, our Board of Directors approved a restructuring plan (the “Restructuring Plan”)
designed to reduce our overall headcount and migrate positions from various facilities, primarily within North America and Europe,
to regional operating centers. As of September 30, 2011, we had incurred all of the expenses related to this Restructuring Plan.
Total expense incurred under the Restructuring Plan for the period from May 25, 2010 through December 31, 2011 was $106 million,
consisting of $75 million for severance and employee related benefits, $5 million for facility closures, including lease terminations,
and $26 million for other expenses. Included in these expenses are $2 million of non-cash expenses related to fixed asset and
leasehold improvement write-offs and accelerated depreciation at impacted facilities. Total cost savings of approximately $70
million and $55 million were generated in 2012 and 2011, respectively.
There were no restructuring and related expenses incurred during the year ended December 31, 2012, but for the years ended
December 31, 2011 and 2010, restructuring and related expenses of $10.6 million and $15.0 million, respectively, are classified
within “Cost of services” and $36.2 million and $44.5 million, respectively, are classified within “Selling, general and
administrative” in the Consolidated Statements of Income.