Western Union 2012 Annual Report Download - page 106
Download and view the complete annual report
Please find page 106 of the 2012 Western Union annual report below. You can navigate through the pages in the report by either clicking on the pages listed below, or by using the keyword search tool below to find specific information within the annual report.-
 1
1 -
2
-
3
-
4
-
5
-
6
-
7
-
8
-
9
-
10
-
11
-
12
-
13
-
14
-
15
-
16
-
17
-
18
-
19
-
20
-
21
-
22
-
23
-
24
-
25
-
26
-
27
-
28
-
29
-
30
-
31
-
32
-
33
-
34
-
35
-
36
-
37
-
38
-
39
-
40
-
41
-
42
-
43
-
44
-
45
-
46
-
47
-
48
-
49
-
50
-
51
-
52
-
53
-
54
-
55
-
56
-
57
-
58
-
59
-
60
-
61
-
62
-
63
-
64
-
65
-
66
-
67
-
68
-
69
-
70
-
71
-
72
-
73
-
74
-
75
-
76
-
77
-
78
-
79
-
80
-
81
-
82
-
83
-
84
-
85
-
86
-
87
-
88
-
89
-
90
-
91
-
92
-
93
-
94
-
95
-
 96
96 -
 97
97 -
 98
98 -
 99
99 -
 100
100 -
 101
101 -
 102
102 -
 103
103 -
 104
104 -
 105
105 -
 106
106 -
 107
107 -
 108
108 -
 109
109 -
 110
110 -
 111
111 -
 112
112 -
 113
113 -
 114
114 -
 115
115 -
 116
116 -
117
-
118
-
119
-
120
-
121
-
122
-
123
-
124
-
125
-
126
-
127
-
128
-
129
-
130
-
131
-
132
-
133
-
134
-
135
-
136
-
137
-
138
-
139
-
140
-
141
-
142
-
143
-
144
-
145
-
146
-
147
-
148
-
149
-
150
-
151
-
152
-
153
-
154
-
155
-
156
-
157
-
158
 |
 |

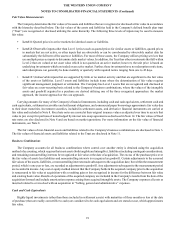
THE WESTERN UNION COMPANY
NOTES TO CONSOLIDATED FINANCIAL STATEMENTS (Continued)
101
2010 Restructuring
On May 25, 2010 and as subsequently revised, the Company's Board of Directors approved a restructuring plan (the
“Restructuring Plan”) designed to reduce the Company's overall headcount and migrate positions from various facilities, primarily
within North America and Europe, to regional operating centers. Details of the expenses incurred are included in the tables below.
Included in these expenses are approximately $2 million of non-cash expenses related to fixed asset and leasehold improvement
write-offs and accelerated depreciation at impacted facilities. As of December 31, 2011, the Company had incurred all of the
expenses related to the Restructuring Plan.
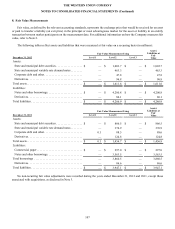
The following table summarizes the activity for the restructuring and related expenses discussed above and the related
restructuring accruals as of and for the years ended December 31, 2012, 2011 and 2010 (in millions):
Severance,
Outplacement
and Related
Benefits
Fixed Asset
Write-Offs and
Accelerated
Depreciation
Lease
Terminations Other (b) Total
Balance, January 1, 2010 . . . . . . . . . . . . . . . . . . . $—$—$—$—$—
Expenses (a) . . . . . . . . . . . . . . . . . . . . . . . . . . . . . 48.7 0.9 — 9.9 59.5
Cash payments . . . . . . . . . . . . . . . . . . . . . . . . . . . (13.7)— —
(8.8)(22.5)
Non-cash charges (a) . . . . . . . . . . . . . . . . . . . . . . (0.7)(0.9)— —
(1.6)
Balance, December 31, 2010 . . . . . . . . . . . . . . . . $ 34.3 $ — $ — $ 1.1 $ 35.4
Expenses (a) . . . . . . . . . . . . . . . . . . . . . . . . . . . . . 26.1 1.3 3.5 15.9 46.8
Cash payments . . . . . . . . . . . . . . . . . . . . . . . . . . . (48.1)—
(3.5)(16.8)(68.4)
Non-cash charges (a) . . . . . . . . . . . . . . . . . . . . . . 1.4 (1.3) — — 0.1
Balance, December 31, 2011 . . . . . . . . . . . . . . . . $ 13.7 $ — $ — $ 0.2 $ 13.9
Cash payments . . . . . . . . . . . . . . . . . . . . . . . . . . . (11.9)— —
(0.2)(12.1)
Balance, December 31, 2012 . . . . . . . . . . . . . . . . $1.8$—$—$—$1.8
Total expenses . . . . . . . . . . . . . . . . . . . . . . . . . . . $ 74.8 $ 2.2 $ 3.5 $ 25.8 $ 106.3
_____________
(a) Expenses include non-cash write-offs and accelerated depreciation of fixed assets and leasehold improvements. However,
these amounts were recognized outside of the restructuring accrual.
(b) Other expenses related to the relocation of various operations to new and existing Company facilities including expenses
for hiring, training, relocation, travel and professional fees. All such expenses were recorded when incurred.
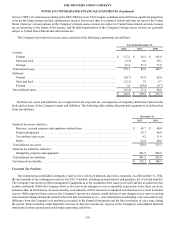
The following table presents productivity and cost-savings initiatives and restructuring and related expenses as reflected in
the Consolidated Statements of Income (in millions):
Year Ended December 31,
2012 2011 2010
Productivity and
Cost-Savings
Initiatives Restructuring and Related Expenses
Cost of services . . . . . . . . . . . . . . . . . . . . . . . . . . . . . . . . . . . . . . . . . . . . $ 5.5 $ 10.6 $ 15.0
Selling, general and administrative . . . . . . . . . . . . . . . . . . . . . . . . . . . . . 25.4 36.2 44.5
Total expenses, pre-tax. . . . . . . . . . . . . . . . . . . . . . . . . . . . . . . . . . . . . . . $ 30.9 $ 46.8 $ 59.5
Total expenses, net of tax. . . . . . . . . . . . . . . . . . . . . . . . . . . . . . . . . . . . . $ 20.2 $ 32.0 $ 39.3
There were no restructuring and related expenses incurred during the year ended December 31, 2012.