Western Union 2012 Annual Report Download - page 64
Download and view the complete annual report
Please find page 64 of the 2012 Western Union annual report below. You can navigate through the pages in the report by either clicking on the pages listed below, or by using the keyword search tool below to find specific information within the annual report.-
 1
1 -
2
-
3
-
4
-
5
-
6
-
7
-
8
-
9
-
10
-
11
-
12
-
13
-
14
-
15
-
16
-
17
-
18
-
19
-
20
-
21
-
22
-
23
-
24
-
25
-
26
-
27
-
28
-
29
-
30
-
31
-
32
-
33
-
34
-
35
-
36
-
37
-
38
-
39
-
40
-
41
-
42
-
43
-
44
-
45
-
46
-
47
-
48
-
49
-
50
-
51
-
52
-
53
-
 54
54 -
 55
55 -
 56
56 -
 57
57 -
 58
58 -
 59
59 -
 60
60 -
 61
61 -
 62
62 -
 63
63 -
 64
64 -
 65
65 -
 66
66 -
 67
67 -
 68
68 -
 69
69 -
 70
70 -
 71
71 -
 72
72 -
 73
73 -
 74
74 -
75
-
76
-
77
-
78
-
79
-
80
-
81
-
82
-
83
-
84
-
85
-
86
-
87
-
88
-
89
-
90
-
91
-
92
-
93
-
94
-
95
-
96
-
97
-
98
-
99
-
100
-
101
-
102
-
103
-
104
-
105
-
106
-
107
-
108
-
109
-
110
-
111
-
112
-
113
-
114
-
115
-
116
-
117
-
118
-
119
-
120
-
121
-
122
-
123
-
124
-
125
-
126
-
127
-
128
-
129
-
130
-
131
-
132
-
133
-
134
-
135
-
136
-
137
-
138
-
139
-
140
-
141
-
142
-
143
-
144
-
145
-
146
-
147
-
148
-
149
-
150
-
151
-
152
-
153
-
154
-
155
-
156
-
157
-
158
 |
 |
59
(a) Significant allocations are made in determining the transaction and revenue growth rates under the regional view in the
above table. The geographic split for transactions and revenue is determined based upon the region where the money transfer
is initiated and the region where the money transfer is paid. For transactions originated and paid in different regions, we
split the transaction count and revenue between the two regions, with each region receiving 50%. For money transfers
initiated and paid in the same region, 100% of the revenue and transactions are attributed to that region. For money transfers
initiated through our websites (“westernunion.com”), 100% of the revenue and transactions are attributed to
westernunion.com.
We view our Consumer-to-Consumer money transfer service as one interconnected global network where a money transfer
can be sent from one location to another, around the world, including related transactions that can be initiated through our
websites and account based money transfers. The segment includes six regions whose functions are limited to generating,
managing and maintaining agent relationships and localized marketing activities. These regions interact on transactions with
consumers and share common processes, systems and licenses, thereby constituting one global Consumer-to-Consumer
money transfer business and one operating segment.
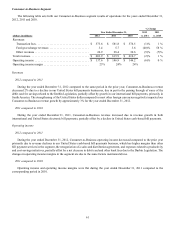
Transaction fees and foreign exchange revenues
2012 compared to 2011
For the year ended December 31, 2012 compared to the prior year, Consumer-to-Consumer money transfer revenue declined
1%, due to the strengthening of the United States dollar compared to most other foreign currencies, which negatively impacted
revenue, and slight price reductions, partially offset by transaction growth of 2%. The strengthening of the United States dollar
compared to most other foreign currencies negatively impacted our revenue growth by approximately 2% for the year ended
December 31, 2012.
Revenue in our Europe and CIS region decreased 6% compared to the prior year on a transaction decline of 1%. The
strengthening of the United States dollar compared to most other foreign currencies and price reductions negatively impacted
revenues for the year ended December 31, 2012. The region has been impacted by continued economic softness in Southern Europe
and increased competition in Russia.
The North America region experienced a revenue decline of 3% on a transaction decline of 1% for the year ended December
31, 2012 compared to the prior year. Our Mexico business declined primarily due to changes to our compliance related practices
as a result of our agreement and settlement with the State of Arizona and changes to our business model and price reductions.
These compliance changes, primarily related to our Vigo and Orlandi Valuta brands, have resulted in the loss of over 7,000 agent
locations in Mexico. Our domestic business (transactions between and within the United States and Canada) experienced an
increase in revenues on transaction growth, primarily in lower principal bands which generate lower revenues per transaction. Our
United States outbound business experienced revenue and transaction declines, in part due to changes in our compliance related
practices as a result of our agreement and settlement with the State of Arizona and changes to our business model, primarily for
our Vigo brand to Latin America, and price reductions.
Revenue in our Middle East and Africa, APAC, and LACA regions increased in the year ended December 31, 2012 compared
to the prior year in all three regions due to transaction growth, partially offset by slight price reductions. Revenue in our Middle
East and Africa and LACA regions was also negatively impacted by the strengthening of the United States dollar compared to
most other foreign currencies. Revenue in our LACA region was positively impacted by geographic and product mix in the year
ended December 31, 2012 compared to the prior year, partially offset by a loss in revenue due to changes to our compliance related
practices as a result of our agreement and settlement with the State of Arizona and changes to our business model, primarily related
to our Vigo brand. The Gulf States, primarily Saudi Arabia, and India displayed revenue growth, but China revenue declined.
Revenue generated from transactions initiated at westernunion.com increased for the year ended December 31, 2012 compared
to the prior year due to strong transaction growth.
Foreign exchange revenues were materially consistent for the year ended December 31, 2012 compared to the prior year.
Fluctuations in the exchange rate between the United States dollar and currencies other than the United States dollar have
resulted in a reduction to transaction fees and foreign exchange revenues for the year ended December 31, 2012 of $77.6 million
over the prior year, net of foreign currency hedges, that would not have occurred had there been constant currency rates.