Western Union 2012 Annual Report Download - page 68
Download and view the complete annual report
Please find page 68 of the 2012 Western Union annual report below. You can navigate through the pages in the report by either clicking on the pages listed below, or by using the keyword search tool below to find specific information within the annual report.-
 1
1 -
2
-
3
-
4
-
5
-
6
-
7
-
8
-
9
-
10
-
11
-
12
-
13
-
14
-
15
-
16
-
17
-
18
-
19
-
20
-
21
-
22
-
23
-
24
-
25
-
26
-
27
-
28
-
29
-
30
-
31
-
32
-
33
-
34
-
35
-
36
-
37
-
38
-
39
-
40
-
41
-
42
-
43
-
44
-
45
-
46
-
47
-
48
-
49
-
50
-
51
-
52
-
53
-
54
-
55
-
56
-
57
-
 58
58 -
 59
59 -
 60
60 -
 61
61 -
 62
62 -
 63
63 -
 64
64 -
 65
65 -
 66
66 -
 67
67 -
 68
68 -
 69
69 -
 70
70 -
 71
71 -
 72
72 -
 73
73 -
 74
74 -
 75
75 -
 76
76 -
 77
77 -
 78
78 -
79
-
80
-
81
-
82
-
83
-
84
-
85
-
86
-
87
-
88
-
89
-
90
-
91
-
92
-
93
-
94
-
95
-
96
-
97
-
98
-
99
-
100
-
101
-
102
-
103
-
104
-
105
-
106
-
107
-
108
-
109
-
110
-
111
-
112
-
113
-
114
-
115
-
116
-
117
-
118
-
119
-
120
-
121
-
122
-
123
-
124
-
125
-
126
-
127
-
128
-
129
-
130
-
131
-
132
-
133
-
134
-
135
-
136
-
137
-
138
-
139
-
140
-
141
-
142
-
143
-
144
-
145
-
146
-
147
-
148
-
149
-
150
-
151
-
152
-
153
-
154
-
155
-
156
-
157
-
158
 |
 |

63
Other
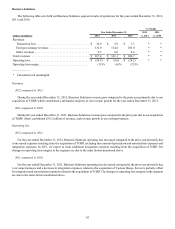
The following table sets forth other results for the years ended December 31, 2012, 2011 and 2010.
% Change
Year Ended December 31, 2012 2011
(dollars in millions) 2012 2011 2010 vs. 2011 vs. 2010
Revenues . . . . . . . . . . . . . . . . . . . . . . . . . . . . . . . . . . . . . . . . . . . . $ 109.2 $ 106.0 $ 91.9 3% 15%
Operating loss . . . . . . . . . . . . . . . . . . . . . . . . . . . . . . . . . . . . . . . . $ (19.7)$ (21.5)$ (5.7)* *
____________
* Calculation not meaningful
Revenues
2012 compared to 2011
Other revenue increased for the year ended December 31, 2012 compared to the prior year primarily due to increases in our
prepaid business, partially offset by a decrease in investment income in our money order business.
2011 compared to 2010
Other revenue grew for the year ended December 31, 2011 compared to the prior year primarily due to volume increases in
our prepaid business.
Operating loss
2012 compared to 2011
During the year ended December 31, 2012, the decrease in operating loss was due to costs associated with acquisition activity
that occurred in the prior year, partially offset by declines in our money order business, including a decrease in investment income,
and expenses related to productivity and cost-savings initiatives.
2011 compared to 2010
During the year ended December 31, 2011, the increase in operating loss compared to the prior year was primarily due to deal
costs associated with the TGBP acquisition.
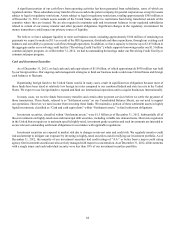
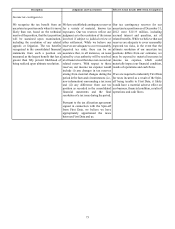
Capital Resources and Liquidity
Our primary source of liquidity has been cash generated from our operating activities, primarily from net income and
fluctuations in working capital. Our working capital is affected by the timing of interest payments on our outstanding borrowings,
timing of income tax payments, including our tax deposit described further in “Cash Flows from Operating Activities,” and
collections on receivables, among other items. The majority of our interest payments are due in the second and fourth quarters
which results in a decrease in the amount of cash provided by operating activities in those quarters and a corresponding increase
to the first and third quarters.
Our future cash flows could be impacted by a variety of factors, some of which are out of our control, including changes in
economic conditions, especially those impacting the migrant population and changes in income tax laws or the status of income
tax audits, including the resolution of outstanding tax matters.