Western Union 2012 Annual Report Download - page 114
Download and view the complete annual report
Please find page 114 of the 2012 Western Union annual report below. You can navigate through the pages in the report by either clicking on the pages listed below, or by using the keyword search tool below to find specific information within the annual report.-
 1
1 -
2
-
3
-
4
-
5
-
6
-
7
-
8
-
9
-
10
-
11
-
12
-
13
-
14
-
15
-
16
-
17
-
18
-
19
-
20
-
21
-
22
-
23
-
24
-
25
-
26
-
27
-
28
-
29
-
30
-
31
-
32
-
33
-
34
-
35
-
36
-
37
-
38
-
39
-
40
-
41
-
42
-
43
-
44
-
45
-
46
-
47
-
48
-
49
-
50
-
51
-
52
-
53
-
54
-
55
-
56
-
57
-
58
-
59
-
60
-
61
-
62
-
63
-
64
-
65
-
66
-
67
-
68
-
69
-
70
-
71
-
72
-
73
-
74
-
75
-
76
-
77
-
78
-
79
-
80
-
81
-
82
-
83
-
84
-
85
-
86
-
87
-
88
-
89
-
90
-
91
-
92
-
93
-
94
-
95
-
96
-
97
-
98
-
99
-
100
-
101
-
102
-
103
-
 104
104 -
 105
105 -
 106
106 -
 107
107 -
 108
108 -
 109
109 -
 110
110 -
 111
111 -
 112
112 -
 113
113 -
 114
114 -
 115
115 -
 116
116 -
 117
117 -
 118
118 -
 119
119 -
 120
120 -
 121
121 -
 122
122 -
 123
123 -
 124
124 -
125
-
126
-
127
-
128
-
129
-
130
-
131
-
132
-
133
-
134
-
135
-
136
-
137
-
138
-
139
-
140
-
141
-
142
-
143
-
144
-
145
-
146
-
147
-
148
-
149
-
150
-
151
-
152
-
153
-
154
-
155
-
156
-
157
-
158
 |
 |

THE WESTERN UNION COMPANY
NOTES TO CONSOLIDATED FINANCIAL STATEMENTS (Continued)
109
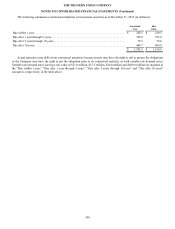
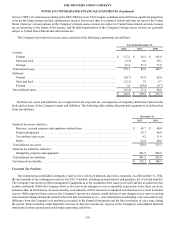
10. Income Taxes
The components of pre-tax income, generally based on the jurisdiction of the legal entity, were as follows (in millions):
Year Ended December 31,
2012 2011 2010
Components of pre-tax income:
Domestic . . . . . . . . . . . . . . . . . . . . . . . . . . . . . . . . . . . . . . . . . . . . . . . . . . . . . . . . . . . . $ 94.8 $ 423.9 $ 151.4
Foreign . . . . . . . . . . . . . . . . . . . . . . . . . . . . . . . . . . . . . . . . . . . . . . . . . . . . . . . . . . . . . 1,074.0 850.7 993.8
$ 1,168.8 $ 1,274.6 $ 1,145.2
For the years ended December 31, 2012, 2011 and 2010, 92%, 67% and 87% of the Company's pre-tax income was derived
from foreign sources, respectively. For the year ended December 31, 2011, the increase in domestic pre-tax income and decrease
in foreign pre-tax income were primarily due to the pre-tax impact of the Company's agreement with the United States Internal
Revenue Service (“IRS Agreement”) resolving substantially all of the issues related to the Company's restructuring of its
international operations in 2003.
The provision for income taxes was as follows (in millions):
Year Ended December 31,
2012 2011 2010
Federal . . . . . . . . . . . . . . . . . . . . . . . . . . . . . . . . . . . . . . . . . . . . . . . . . . . . . . . . . . . . . . . . $ 92.5 $ 78.1 $ 132.2
State and local . . . . . . . . . . . . . . . . . . . . . . . . . . . . . . . . . . . . . . . . . . . . . . . . . . . . . . . . . . (14.8) 4.5 39.8
Foreign. . . . . . . . . . . . . . . . . . . . . . . . . . . . . . . . . . . . . . . . . . . . . . . . . . . . . . . . . . . . . . . . 65.2 26.6 63.3
$ 142.9 $ 109.2 $ 235.3
Domestic taxes have been incurred on certain pre-tax income amounts that were generated by the Company's foreign operations.
Accordingly, the percentage obtained by dividing the total federal, state and local tax provision by the domestic pre-tax income,
all as shown in the preceding tables, may be higher than the statutory tax rates in the United States.
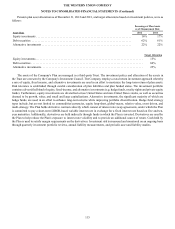
The Company's effective tax rates differed from statutory rates as follows:
Year Ended December 31,
2012 2011 2010
Federal statutory rate . . . . . . . . . . . . . . . . . . . . . . . . . . . . . . . . . . . . . . . . . . . . . . . . . . . . . 35.0 % 35.0 % 35.0 %
State income taxes, net of federal income tax benefits . . . . . . . . . . . . . . . . . . . . . . . . . . . 0.6 % 2.0 % 1.9 %
Foreign rate differential, net of U.S. tax paid on foreign earnings (5.1%, 1.2%, and 5.1%,
respectively) . . . . . . . . . . . . . . . . . . . . . . . . . . . . . . . . . . . . . . . . . . . . . . . . . . . . . . . . . . . (22.5)% (14.0)% (12.0)%
IRS Agreement . . . . . . . . . . . . . . . . . . . . . . . . . . . . . . . . . . . . . . . . . . . . . . . . . . . . . . . . . — % (16.1)% — %
Other . . . . . . . . . . . . . . . . . . . . . . . . . . . . . . . . . . . . . . . . . . . . . . . . . . . . . . . . . . . . . . . . . (0.9)% 1.7 % (4.4)%
Effective tax rate . . . . . . . . . . . . . . . . . . . . . . . . . . . . . . . . . . . . . . . . . . . . . . . . . . . . . . . . 12.2 % 8.6 % 20.5 %
For the years ended December 31, 2012 and 2011, the Company's effective tax rate significantly decreased due to the IRS
Agreement, which resolved substantially all of the issues related to the Company's restructuring of its international operations in
2003, as described below, and resulted in a tax benefit of $204.7 million related to the adjustment of reserves associated with this
matter for the year ended December 31, 2011. For the year ended December 31, 2012, the Company's effective tax rate was also
impacted by benefits from favorable tax settlements and changes in the mix of foreign and U.S. income and applicable tax rates,
and for the year ended December 31, 2011, the Company's effective tax rate was also impacted by higher taxes associated with
the Finint and Costa remeasurement gains (see Note 3). The tax rate for the year ended December 31, 2010 was impacted by a
cumulative tax planning benefit from certain foreign acquisitions and the settlement with the United States Internal Revenue