Western Union 2012 Annual Report Download - page 135
Download and view the complete annual report
Please find page 135 of the 2012 Western Union annual report below. You can navigate through the pages in the report by either clicking on the pages listed below, or by using the keyword search tool below to find specific information within the annual report.-
 1
1 -
2
-
3
-
4
-
5
-
6
-
7
-
8
-
9
-
10
-
11
-
12
-
13
-
14
-
15
-
16
-
17
-
18
-
19
-
20
-
21
-
22
-
23
-
24
-
25
-
26
-
27
-
28
-
29
-
30
-
31
-
32
-
33
-
34
-
35
-
36
-
37
-
38
-
39
-
40
-
41
-
42
-
43
-
44
-
45
-
46
-
47
-
48
-
49
-
50
-
51
-
52
-
53
-
54
-
55
-
56
-
57
-
58
-
59
-
60
-
61
-
62
-
63
-
64
-
65
-
66
-
67
-
68
-
69
-
70
-
71
-
72
-
73
-
74
-
75
-
76
-
77
-
78
-
79
-
80
-
81
-
82
-
83
-
84
-
85
-
86
-
87
-
88
-
89
-
90
-
91
-
92
-
93
-
94
-
95
-
96
-
97
-
98
-
99
-
100
-
101
-
102
-
103
-
104
-
105
-
106
-
107
-
108
-
109
-
110
-
111
-
112
-
113
-
114
-
115
-
116
-
117
-
118
-
119
-
120
-
121
-
122
-
123
-
124
-
 125
125 -
 126
126 -
 127
127 -
 128
128 -
 129
129 -
 130
130 -
 131
131 -
 132
132 -
 133
133 -
 134
134 -
 135
135 -
 136
136 -
 137
137 -
 138
138 -
 139
139 -
 140
140 -
 141
141 -
 142
142 -
 143
143 -
 144
144 -
 145
145 -
146
-
147
-
148
-
149
-
150
-
151
-
152
-
153
-
154
-
155
-
156
-
157
-
158
 |
 |

THE WESTERN UNION COMPANY
NOTES TO CONSOLIDATED FINANCIAL STATEMENTS (Continued)
130
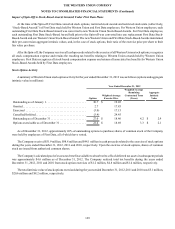
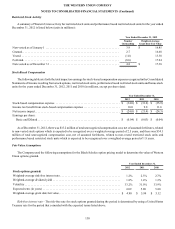
Restricted Stock Activity
A summary of Western Union activity for restricted stock units and performance based restricted stock units for the year ended
December 31, 2012 is listed below (units in millions):
Year Ended December 31, 2012
Number
Outstanding
Weighted-Average
Grant-Date Fair Value
Non-vested as of January 1 . . . . . . . . . . . . . . . . . . . . . . . . . . . . . . . . . . . . . . . . . . . . . . . . . . 3.9 $ 16.85
Granted. . . . . . . . . . . . . . . . . . . . . . . . . . . . . . . . . . . . . . . . . . . . . . . . . . . . . . . . . . . . . . . . . . 2.7 16.68
Vested. . . . . . . . . . . . . . . . . . . . . . . . . . . . . . . . . . . . . . . . . . . . . . . . . . . . . . . . . . . . . . . . . . . (1.0) 13.38
Forfeited. . . . . . . . . . . . . . . . . . . . . . . . . . . . . . . . . . . . . . . . . . . . . . . . . . . . . . . . . . . . . . . . . (0.8) 17.24
Non-vested as of December 31 . . . . . . . . . . . . . . . . . . . . . . . . . . . . . . . . . . . . . . . . . . . . . . . 4.8 $ 17.38
Stock-Based Compensation
The following table sets forth the total impact on earnings for stock-based compensation expense recognized in the Consolidated
Statements of Income resulting from stock options, restricted stock units, performance based restricted stock units and bonus stock
units for the years ended December 31, 2012, 2011 and 2010 (in millions, except per share data).
Year Ended December 31,
2012 2011 2010
Stock-based compensation expense . . . . . . . . . . . . . . . . . . . . . . . . . . . . . . . . . . . . . . . . . . . . $ (34.0)$ (31.2)$ (35.9)
Income tax benefit from stock-based compensation expense . . . . . . . . . . . . . . . . . . . . . . . . . 10.0 9.8 11.6
Net income impact. . . . . . . . . . . . . . . . . . . . . . . . . . . . . . . . . . . . . . . . . . . . . . . . . . . . . . . . . . $ (24.0)$ (21.4)$ (24.3)
Earnings per share:
Basic and Diluted . . . . . . . . . . . . . . . . . . . . . . . . . . . . . . . . . . . . . . . . . . . . . . . . . . . . . . . .$ (0.04)$ (0.03)$ (0.04)
As of December 31, 2012, there was $15.2 million of total unrecognized compensation cost, net of assumed forfeitures, related
to non-vested stock options which is expected to be recognized over a weighted-average period of 2.5 years, and there was $34.1
million of total unrecognized compensation cost, net of assumed forfeitures, related to non-vested restricted stock units and
performance based restricted stock units which is expected to be recognized over a weighted-average period of 1.8 years.
Fair Value Assumptions
The Company used the following assumptions for the Black-Scholes option pricing model to determine the value of Western
Union options granted.
Year Ended December 31,
2012 2011 2010
Stock options granted:
Weighted-average risk-free interest rate . . . . . . . . . . . . . . . . . . . . . . . . . . . . . . . . . . . . . . . . . 1.2% 2.5% 2.7%
Weighted-average dividend yield . . . . . . . . . . . . . . . . . . . . . . . . . . . . . . . . . . . . . . . . . . . . . . 1.8% 1.4% 1.3%
Volatility . . . . . . . . . . . . . . . . . . . . . . . . . . . . . . . . . . . . . . . . . . . . . . . . . . . . . . . . . . . . . . . . . 33.2% 31.0% 33.9%
Expected term (in years) . . . . . . . . . . . . . . . . . . . . . . . . . . . . . . . . . . . . . . . . . . . . . . . . . . . . . 6.09 5.80 5.80
Weighted-average grant date fair value. . . . . . . . . . . . . . . . . . . . . . . . . . . . . . . . . . . . . . . . . . $ 4.90 $ 5.99 $ 5.12
Risk-free interest rate - The risk-free rate for stock options granted during the period is determined by using a United States
Treasury rate for the period that coincided with the expected terms listed above.