WeightWatchers 2010 Annual Report Download - page 99
Download and view the complete annual report
Please find page 99 of the 2010 WeightWatchers annual report below. You can navigate through the pages in the report by either clicking on the pages listed below, or by using the keyword search tool below to find specific information within the annual report.-
 1
1 -
2
-
3
-
4
-
5
-
6
-
7
-
8
-
9
-
10
-
11
-
12
-
13
-
14
-
15
-
16
-
17
-
18
-
19
-
20
-
21
-
22
-
23
-
24
-
25
-
26
-
27
-
28
-
29
-
30
-
31
-
32
-
33
-
34
-
35
-
36
-
37
-
38
-
39
-
40
-
41
-
42
-
43
-
44
-
45
-
46
-
47
-
48
-
49
-
50
-
51
-
52
-
53
-
54
-
55
-
56
-
57
-
58
-
59
-
60
-
61
-
62
-
63
-
64
-
65
-
66
-
67
-
68
-
69
-
70
-
71
-
72
-
73
-
74
-
75
-
76
-
77
-
78
-
79
-
80
-
81
-
82
-
83
-
84
-
85
-
86
-
87
-
88
-
 89
89 -
 90
90 -
 91
91 -
 92
92 -
 93
93 -
 94
94 -
 95
95 -
 96
96 -
 97
97 -
 98
98 -
 99
99 -
 100
100 -
 101
101 -
 102
102 -
 103
103 -
 104
104 -
 105
105 -
 106
106 -
 107
107 -
 108
108 -
 109
109 -
110
-
111
-
112
-
113
-
114
-
115
-
116
-
117
-
118
-
119
-
120
-
121
-
122
-
123
-
124
-
125
-
126
-
127
-
128
 |
 |

WEIGHT WATCHERS INTERNATIONAL, INC. AND SUBSIDIARIE
S
NO
TE
S
T
OCO
N
SO
LIDATED FINAN
C
IAL
S
TATEMENT
S
(
IN THOUSANDS, EXCEPT PER SHARE AMOUNTS
)
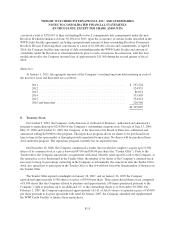
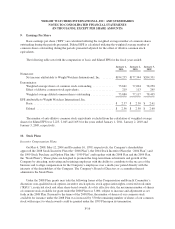
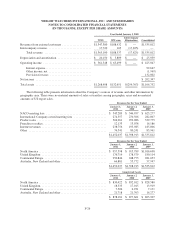
The weighted-average grant-date fair value of RSUs granted was
$
25.69,
$
19.86 and
$
43.84 for the year
s
ended January 1, 2011, January 2, 2010 and January 3, 2009, respectively. The total fair value of RSUs vested
during the years ended January 1, 2011, January 2, 2010 and January 3, 2009 was
$
2,341,
$
6,098 and
$
1,580
,
r
espectively.
11
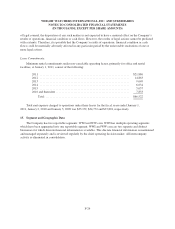
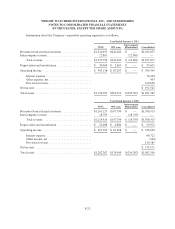
. Income Taxes
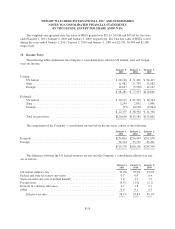
The following tables summarize the Company’s consolidated provision for US federal, state and foreig
n
taxes on income
:
Januar
y
1
,
2011
Januar
y
2
,
2010
J
anuar
y
3,
2009
C
urrent
:
US f
e
d
era
l
.................................................. $ 68,126 $ 71,409 $ 88,41
7
S
tate
......................................................
1
1,4
6
2 11,734 13,082
F
orei
g
n
....................................................
1
8,693 (5,950) 19,147
$
98,281
$
77,193
$
120,64
6
De
f
erre
d:
US
f
e
d
era
l
..................................................
$
2
0
,
115
$
25
,
302
$
18
,
344
S
tate
......................................................
2
,
299 2
,
892 2
,
09
6
F
ore
i
gn
....................................................
(39) 10
,
198 (9
,
084)
$
22,375 $ 38,392 $ 11,35
6
Total tax
p
rovision
...........................................
$
120,656
$
115,585
$
132,002
The components of the Company’s consolidated income before income taxes consist of the following:
Januar
y
1
,
2011
Januar
y
2
,
2010
J
anuar
y
3,
2009
Domest
ic
.......................................................
$
236,864 $256,405 $291,858
Fore
ig
n
........................................................
76,314 33,751 42,491
$
313,178
$
290,156
$
334,34
9
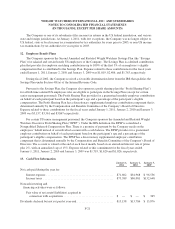
The difference between the US federal statutory tax rate and the Company’s consolidated effective tax rat
e
are as follows
:
Januar
y
1
,
2011
J
anuar
y
2,
2010
J
anuar
y
3
,
2009
U
S federal statutor
y
rate
...........................................
35
.
0
%
35
.
0
%
35
.
0%
F
ederal and state tax reserve
p
rovision ................................
0
.7
0
.4
0
.4
S
tates income taxes (net of federal benefit) ............................
3
.
03
.
53
.2
F
orei
g
n taxes
....................................................
(0.9) (1.0) (1.1
)
Increase in
v
aluation allo
w
anc
e
......................................
0
.7 1.
8
1.7
O
ther
.
.........................................................
0
.
00
.1
0
.
3
E
ffective tax rate
.............................................
38.
5
%3
9
.8% 3
9
.
5%
F-
19