WeightWatchers 2010 Annual Report Download - page 55
Download and view the complete annual report
Please find page 55 of the 2010 WeightWatchers annual report below. You can navigate through the pages in the report by either clicking on the pages listed below, or by using the keyword search tool below to find specific information within the annual report.-
 1
1 -
2
-
3
-
4
-
5
-
6
-
7
-
8
-
9
-
10
-
11
-
12
-
13
-
14
-
15
-
16
-
17
-
18
-
19
-
20
-
21
-
22
-
23
-
24
-
25
-
26
-
27
-
28
-
29
-
30
-
31
-
32
-
33
-
34
-
35
-
36
-
37
-
38
-
39
-
40
-
41
-
42
-
43
-
44
-
 45
45 -
 46
46 -
 47
47 -
 48
48 -
 49
49 -
 50
50 -
 51
51 -
 52
52 -
 53
53 -
 54
54 -
 55
55 -
 56
56 -
 57
57 -
 58
58 -
 59
59 -
 60
60 -
 61
61 -
 62
62 -
 63
63 -
 64
64 -
 65
65 -
66
-
67
-
68
-
69
-
70
-
71
-
72
-
73
-
74
-
75
-
76
-
77
-
78
-
79
-
80
-
81
-
82
-
83
-
84
-
85
-
86
-
87
-
88
-
89
-
90
-
91
-
92
-
93
-
94
-
95
-
96
-
97
-
98
-
99
-
100
-
101
-
102
-
103
-
104
-
105
-
106
-
107
-
108
-
109
-
110
-
111
-
112
-
113
-
114
-
115
-
116
-
117
-
118
-
119
-
120
-
121
-
122
-
123
-
124
-
125
-
126
-
127
-
128
 |
 |
such awards. Upon adoption of this accounting guidance, we elected to apply the modified prospective transition
method to all past awards outstanding and unvested as of the date of adoption and began recognizing th
e
associated expense over the remaining vesting period based on the fair values previously determined an
d
disclosed as
p
art of our
p
ro forma disclosures in fiscal 200
6
. We have not restated the results of
p
rior
p
eriods.
The fair value of restricted stock units and vested shares of restricted stock is determined by the market
p
rice of our common stock on the date of grant. The fair value of option awards is estimated on the date of grant
using the Black-Scholes option pricing model, which requires estimates of the expected term of the option, the
expected volatility of the Company’s stock price, the risk-free interest rate and the expected dividend yield. We
r
ecognize expense for all share-based awards based on the fair value of the number of awards we estimate will
f
ully vest. A change in these underlying assumptions will cause a change in the estimated fair value of share
-
based awards and the underlying expense recorded. We continue to evaluate these estimates and assumptions an
d
believe that these assum
p
tions are a
pp
ro
p
riate.
R
ESULTS OF OPERATIONS FOR FISCAL 2010
(
52 weeks
)
COMPARED TO FISCAL 2009
(
52 weeks
)
F
iscal 2010 revenues were
$
1,452.0 million, an increase of
$
53.1 million, or 3.8%, as com
p
ared to the
p
rio
r
y
ear period. Net income attributable to the Company for fiscal 2010 was
$
194.2 million, an increase of
$
16.
9
million, or 9.5%, from
$
177.3 million for the prior year period.
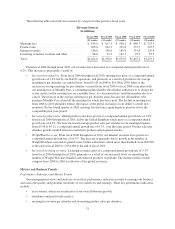
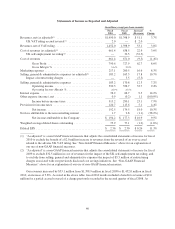
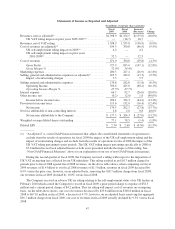
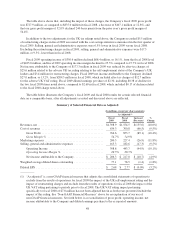
The table below shows our consolidated statements of income for fiscal 2010 versus fiscal 200
9
on both
a
r
eported basis and an adjusted basis. Results for fiscal 2010 are adjusted to exclude the
$
2.0 million benefit t
o
r
evenue of an over-accrual related to the adverse UK VAT ruling which had been previously disclosed in the
second quarter of fiscal 2008. Results for fiscal 2009 are adjusted to exclude
$
32.5 million in expenses associate
d
with the impact of the previously disclosed adverse UK self-employment tax ruling related to periods prior to
f
iscal 2009, and to exclude the
$
5.5 million in restructuring charges associated with our previously disclosed cost
savings initiatives. See “Non-GAAP Financial Measures” above
.
39