WeightWatchers 2010 Annual Report Download - page 52
Download and view the complete annual report
Please find page 52 of the 2010 WeightWatchers annual report below. You can navigate through the pages in the report by either clicking on the pages listed below, or by using the keyword search tool below to find specific information within the annual report.-
 1
1 -
2
-
3
-
4
-
5
-
6
-
7
-
8
-
9
-
10
-
11
-
12
-
13
-
14
-
15
-
16
-
17
-
18
-
19
-
20
-
21
-
22
-
23
-
24
-
25
-
26
-
27
-
28
-
29
-
30
-
31
-
32
-
33
-
34
-
35
-
36
-
37
-
38
-
39
-
40
-
41
-
 42
42 -
 43
43 -
 44
44 -
 45
45 -
 46
46 -
 47
47 -
 48
48 -
 49
49 -
 50
50 -
 51
51 -
 52
52 -
 53
53 -
 54
54 -
 55
55 -
 56
56 -
 57
57 -
 58
58 -
 59
59 -
 60
60 -
 61
61 -
 62
62 -
63
-
64
-
65
-
66
-
67
-
68
-
69
-
70
-
71
-
72
-
73
-
74
-
75
-
76
-
77
-
78
-
79
-
80
-
81
-
82
-
83
-
84
-
85
-
86
-
87
-
88
-
89
-
90
-
91
-
92
-
93
-
94
-
95
-
96
-
97
-
98
-
99
-
100
-
101
-
102
-
103
-
104
-
105
-
106
-
107
-
108
-
109
-
110
-
111
-
112
-
113
-
114
-
115
-
116
-
117
-
118
-
119
-
120
-
121
-
122
-
123
-
124
-
125
-
126
-
127
-
128
 |
 |
in the United States and Canada an
d
P
r
o
P
oi
nt
s
program in the United Kingdom and Australia, increase
d
marketing for our WeightWatchers.com business, and a charge associated with the settlement of the Californi
a
labor litigation
.
F
ranchise Acquisitions
F
rom time to time, we repurchase franchise territories. Since the beginning of fiscal 2001, we have acquired
19 franchise operations for a total net purchase price of approximately
$
681.3 million. These acquisitions ar
e
typically accretive to our earnings per share. For fiscal 2010, the attendance of our remaining franchis
e
o
perations accounted for less than 17% of total worldwide attendance at Weight Watchers meetings.
Non-
G
AAP F
i
nanc
i
al Measures
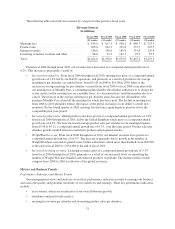
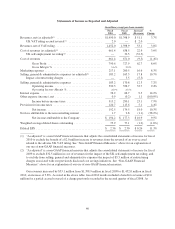
To supplement our consolidated results presented in accordance with accounting principles generall
y
accepted in the United States, or GAAP, we have disclosed non-GAAP measures of operating results tha
t
exclude or adjust certain items. Net revenues, cost of revenues, gross profit and gross margin, operating incom
e
and operating income margin, effective tax rate, including components thereof, are discussed in this Annual
R
eport on Form 10-K both as reported (on a GAAP basis) and as adjusted (on a non-GAAP basis) to exclud
e
f
rom fiscal 2010 the revenue benefit of a partial accrual reversal of a charge originally recorded in the secon
d
quarter of fiscal 2008 in connection with the adverse UK VAT ruling; to adjust the fiscal 2009 results for both
the impact of the adverse UK tax ruling relating to the self-employment status of our UK leaders and the impact
o
f restructuring charges associated with our previously disclosed cost savings initiatives; and to adjust the fiscal
2008 results to exclude the impact of the adverse UK VAT ruling. See “Item 3. Legal Proceedings–UK Self-
Employment Matter and –UK VAT Matter” in Part I of this Annual Report on Form 10-K for further details on
these rulings. We generally refer to such non-GAAP measures as excluding or adjusting for the impact of the
accrual reversal, these rulings and/or these restructuring charges. Our management believes these non-GAA
P
f
inancial measures provide supplemental information to investors regarding the performance of our business and
are useful for
p
eriod-over-
p
eriod com
p
arisons of the
p
erformance of our business. While we believe that thes
e
f
inancial measures are useful in evaluating our business, this information should be considered as supplemental
in n
atu
r
ea
n
d
i
s
n
ot
m
ea
n
ttobeco
n
s
i
de
r
ed
in i
so
l
at
i
o
n
o
r
as a subst
i
tute
f
o
r
t
h
e
r
e
l
ated
fin
a
n
c
i
a
l inf
o
rm
at
i
o
n
p
repared in accordance with GAAP. In addition, these non-GAAP financial measures may not be the same a
s
similarly entitled measures reported by other companies
.
Use o
fC
onstant
C
urrenc
y
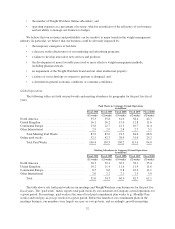
A
s exchange rates are an important factor in understanding period-to-period comparisons, we believe the
p
resentation of results on a constant currency basis in addition to reported results helps improve investors’ ability
to understand our operating results and evaluate our performance in comparison to prior periods. Constant
currency information compares results between periods as if exchange rates had remained constant period-over-
p
eriod. We use results on a constant currency basis as one measure to evaluate our performance. In this Annual
R
eport on Form 10-K, we calculate constant currency by calculating current-year results using prior-year foreig
n
currency exchange rates. We generally refer to such amounts calculated on a constant currency basis as excluding
o
r adjusting for the impact of foreign currency. These results should be considered in addition to, not as a
substitute for, results reported in accordance with GAAP. Results on a constant currency basis, as we presen
t
them, may not be comparable to similarly titled measures used by other companies and are not measures of
p
erformance
p
resented in accordance with GAAP.
C
r
i
t
i
cal Account
i
ng Pol
i
c
i
es
“Management’s Discussion and Analysis of Financial Condition and Results of Operations” is based upon
o
ur consolidated financial statements, which have been
p
re
p
ared in accordance with GAAP. The
p
re
p
aration o
f
these financial statements requires us to make estimates and judgments that affect the reported amounts of assets
,
liabilities, revenues and expenses, and related disclosure of contingent assets and liabilities. On an ongoing basis,
we evaluate our estimates and judgments, including those related to inventories, the impairment analysis fo
r
36