WeightWatchers 2010 Annual Report Download - page 68
Download and view the complete annual report
Please find page 68 of the 2010 WeightWatchers annual report below. You can navigate through the pages in the report by either clicking on the pages listed below, or by using the keyword search tool below to find specific information within the annual report.-
 1
1 -
2
-
3
-
4
-
5
-
6
-
7
-
8
-
9
-
10
-
11
-
12
-
13
-
14
-
15
-
16
-
17
-
18
-
19
-
20
-
21
-
22
-
23
-
24
-
25
-
26
-
27
-
28
-
29
-
30
-
31
-
32
-
33
-
34
-
35
-
36
-
37
-
38
-
39
-
40
-
41
-
42
-
43
-
44
-
45
-
46
-
47
-
48
-
49
-
50
-
51
-
52
-
53
-
54
-
55
-
56
-
57
-
 58
58 -
 59
59 -
 60
60 -
 61
61 -
 62
62 -
 63
63 -
 64
64 -
 65
65 -
 66
66 -
 67
67 -
 68
68 -
 69
69 -
 70
70 -
 71
71 -
 72
72 -
 73
73 -
 74
74 -
 75
75 -
 76
76 -
 77
77 -
 78
78 -
79
-
80
-
81
-
82
-
83
-
84
-
85
-
86
-
87
-
88
-
89
-
90
-
91
-
92
-
93
-
94
-
95
-
96
-
97
-
98
-
99
-
100
-
101
-
102
-
103
-
104
-
105
-
106
-
107
-
108
-
109
-
110
-
111
-
112
-
113
-
114
-
115
-
116
-
117
-
118
-
119
-
120
-
121
-
122
-
123
-
124
-
125
-
126
-
127
-
128
 |
 |
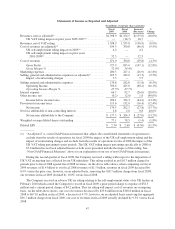
compared to 14.
6
% in the prior year as adjusted for the impact of the UK VAT ruling. Excluding the impact of
f
oreign currency exchange, the year-over-year decrease in marketing expense was
$
17.0 million, or 7.5%. The
meetings business drove the decline which resulted from a combination of advertising rate efficiencies and cos
t
containment efforts across our geographies, particularly in Continental Europe.
S
elling, general and administrative expenses were
$
170.8 million for fiscal 2009 versus
$
182.6 million fo
r
f
iscal 2008, a decrease of
$
11.8 million, or 6.5%. Our selling, general and administrative expenses in fiscal 2009
included
$
5.5 million of restructuring charges associated with our cost savings initiatives and also included
a
$
5.9 million benefit from foreign currency translation. Excluding the restructuring charges and the benefit from
f
oreign currency translation, selling, general and administrative expenses were
$
171.2 million for fiscal 2009, a
decrease of
$
11.4 million, or 6.2%, from the prior year, reflecting cost savings from restructuring and othe
r
initiatives that began to have an impact in the second quarter of fiscal 2009. Selling, general and administrative
expenses declined despite higher investment with respect to our China Joint Venture and increased depreciatio
n
r
esulting from our information technology investments. Our selling, general and administrative expenses were
12.2% of revenues for fiscal 2009. Excluding the negative impact of restructuring charges from our fiscal 2009
r
esults and excluding the impact of the UK VAT ruling from our fiscal 2008 results, selling, general an
d
administrative expenses as a percent of revenues were 11.8% and 11.7%, respectively
.
Our operating income for fiscal 2009 was
$
356.6 million, a decrease of
$
68.4 million, or 16.1%, from th
e
f
iscal 2008 level. Excluding the impact of the adverse UK tax rulings from both years and the restructuring
charges from fiscal 2009, our operating income for fiscal 2009 declined by
$
44.9 million, or 10.1%, from
$
443.
7
million in fiscal 2008 to
$
398.8 million in fiscal 2009. Foreign currency exchange accounted for
$
15.2 million,
o
r 3.4%, of decline. On a constant currency basis, fiscal 2009 operating income, as adjusted for the UK self
-
employment ruling and for restructuring charges, decreased
$
29.7 million, or 6.7%, versus the prior year a
s
adjusted for the UK VAT ruling in fiscal 2008. Volume declines were partially offset by lower marketin
g
expenses and cost savings initiatives across most major expense categories.
Our operating income margin for fiscal 2009 was 2
5
.
5
% versus 27.7% for fiscal 2008. Excluding the UK
self-employment ruling and the restructuring charges in fiscal 2009 and adjusting fiscal 2008 for the UK VA
T
r
uling, our adjusted operating income margin was flat at 28.
5
% in both fiscal 2009 and fiscal 2008.
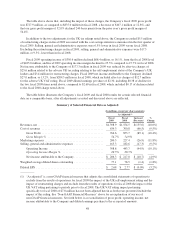
I
nterest ex
p
ense was
$
66.7 million for fiscal 2009, a decrease of
$
26.0 million, or 28.0%, from
$
92.
7
million in fiscal 2008. The Company’s average effective interest rate declined 127 basis points, down from
5
.44% in fiscal 2008 to 4.17% in fiscal 2009, mainly as a result of lower market rates. During 2009, we mad
e
debt payments of
$
194.5 million, reducing our debt outstanding under our credit facility to
$
1.453 billion at th
e
end of fiscal 2009 as com
p
ared to
$
1.648 billion at the end of fiscal 2008.
We re
p
orted other income of
$
0.2 million in fiscal 2009 as com
p
ared to
$
2.0 million in the com
p
arable
p
rio
r
y
ear period. The change resulted primarily from the impact of foreign currency exchange rates on intercompan
y
transactions.
The Company’s effective tax rate was 39.8% in fiscal 2009 and 39.
5
% in fiscal 2008. Our tax rate for bot
h
y
ears was inflated as charges associated with the UK tax rulings in 2009 and 2008 resulted in changes in the
geographic mix of our income in both years. Excluding the UK tax rulings, the effective tax rate was 38.7% i
n
f
iscal 200
9
and 3
9
.1% in fiscal 2008.
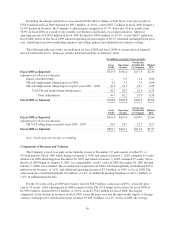
L
iq
u
i
d
i
t
y
and
C
a
pi
tal Resource
s
Balance Sheet Working Capital
Comparing our balance sheet at January 1, 2011 with our balance sheet at January 2, 2010, our working
capital deficit increased by
$
12.6 million. At January 1, 2011, our working capital deficit was
$
348.7 million
,
52