WeightWatchers 2010 Annual Report Download - page 70
Download and view the complete annual report
Please find page 70 of the 2010 WeightWatchers annual report below. You can navigate through the pages in the report by either clicking on the pages listed below, or by using the keyword search tool below to find specific information within the annual report.-
 1
1 -
2
-
3
-
4
-
5
-
6
-
7
-
8
-
9
-
10
-
11
-
12
-
13
-
14
-
15
-
16
-
17
-
18
-
19
-
20
-
21
-
22
-
23
-
24
-
25
-
26
-
27
-
28
-
29
-
30
-
31
-
32
-
33
-
34
-
35
-
36
-
37
-
38
-
39
-
40
-
41
-
42
-
43
-
44
-
45
-
46
-
47
-
48
-
49
-
50
-
51
-
52
-
53
-
54
-
55
-
56
-
57
-
58
-
59
-
 60
60 -
 61
61 -
 62
62 -
 63
63 -
 64
64 -
 65
65 -
 66
66 -
 67
67 -
 68
68 -
 69
69 -
 70
70 -
 71
71 -
 72
72 -
 73
73 -
 74
74 -
 75
75 -
 76
76 -
 77
77 -
 78
78 -
 79
79 -
 80
80 -
81
-
82
-
83
-
84
-
85
-
86
-
87
-
88
-
89
-
90
-
91
-
92
-
93
-
94
-
95
-
96
-
97
-
98
-
99
-
100
-
101
-
102
-
103
-
104
-
105
-
106
-
107
-
108
-
109
-
110
-
111
-
112
-
113
-
114
-
115
-
116
-
117
-
118
-
119
-
120
-
121
-
122
-
123
-
124
-
125
-
126
-
127
-
128
 |
 |

F
i
s
cal 2008
A
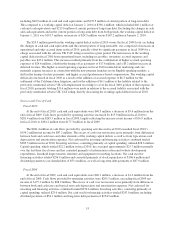
t the end of fiscal 2008, cash and cash e
q
uivalents were
$
47.3 million, an increase of
$
7.5 million from th
e
end of fiscal 2007. Cash flows provided by operating activities were
$
241.2 million. The cash provided b
y
o
perations was driven by our net income of
$
204.3 million, changes in our working capital, and difference
s
between book and cash taxes. Fiscal 2008 cash from operations was negatively impacted by timing of payments
.
Certain fiscal 2007 and fiscal 2009 tax and other payments amounting to approximately
$
30.0 million were made
in fiscal 2008. Investing activities utilized
$
72.2 million, including
$
39.7 million for our fiscal 2008 franchise
acquisitions and
$
31.6 million for capital spending. Net cash used for financing activities totaled
$
160.1 million.
T
his included the re
p
urchase of 2.8 million shares of our common stock for
$
116.0 million and dividend
p
ayments of
$
55.0 million. See “Item 5. Market for Registrant’s Common Equity, Related Shareholder Matter
s
and Issuer Purchases of Equity Securities” of this Annual Report on Form 10-K for more information regarding
o
ur stock repurchase program.
Long-Term Debt
Our credit facilities consist of a term loan facility and a revolving credit facility, or collectively, the WW
I
Credit Facility. The term loan facility consists of two tranche A loans, or Term A Loan and Additional Term
A
Loan, a tranche B loan, or Term B Loan, a tranche C loan, or Term C Loan, and a tranche D loan, or Term
D
Loan, in an aggregate original principal amount of
$
1,550.0 million. The revolving credit facility, or th
e
R
evolver, consists of two tranches, or Revolver I and Revolver II, of up to
$
500.0 million in the aggregate. At the
end of fiscal 2010, we had
$
1,365.1 million outstanding under the WWI Credit Facility. In addition, at the end of
f
iscal 2010, there was
$
325.0 million available under the Revolver
.
A
t the end of fiscal 2010, fiscal 2009 and fiscal 2008, our debt consisted entirely of variable-rate
instruments. Interest rate swaps are entered into to hedge a portion of the cash flow exposure associated with our
variable-rate borrowings. The average interest rate on our debt, exclusive of the impact of swaps, wa
s
approximately 2.2%, 1.
5
% and 4.7% per annum at the end of fiscal 2010, fiscal 2009 and fiscal 2008,
r
espectively.
The following schedule sets forth our long-term debt obligations (and interest rates, exclusive of the impac
t
o
f swaps) at January 1, 2011
:
L
ong-
T
erm
D
e
bt
A
t Januar
y
1, 2011
(
Balances in millions
)
B
a
l
a
n
ce
A
lternative
B
ase
R
at
e
o
r LIBOR
A
ppl
i
cabl
e
M
ar
g
i
n
I
nteres
t
R
a
t
e
R
evo
l
ver I
d
ue 2011 .......................................
$
1.
7
3
.25% 0.00% 3.25%
R
evo
l
ver I
d
ue 2011
.......................................
5
6.6 0.31% 1.00% 1.31%
R
evo
l
ver II
d
ue 2014
.
.....................................
3
.
3
3
.2
5
%1.
5
0% 4.7
5
%
R
evo
l
ver II
d
ue 2014
......................................
112.4 0.31% 2.
5
0% 2.81%
T
erm A Loan
d
ue 2011 ....................................
.
5
8.2 0.31% 1.00% 1.31%
A
ddi
t
i
ona
l
Term A Loan
d
ue 2013 ..........................
.
209
.
10
.
31% 1
.
00% 1
.
31%
T
erm B Loan
d
ue 201
4
....................................
.
240.0 0.31% 1.
5
0% 1.81%
T
erm C Loan due 201
5
....................................
.
443.1 0.31% 2.2
5
%2.
5
6%
T
erm D Loan due 2
0
1
6
.....................................
24
0
.7
0
.
3
1% 2.2
5
%2.
56
%
T
otal Deb
t
.......................................
1,365.
1
L
ess
C
urrent Portion
...................................
197.5
T
otal Long-Term Deb
t
.............................
$
1,167.6
54