WeightWatchers 2010 Annual Report Download - page 64
Download and view the complete annual report
Please find page 64 of the 2010 WeightWatchers annual report below. You can navigate through the pages in the report by either clicking on the pages listed below, or by using the keyword search tool below to find specific information within the annual report.-
 1
1 -
2
-
3
-
4
-
5
-
6
-
7
-
8
-
9
-
10
-
11
-
12
-
13
-
14
-
15
-
16
-
17
-
18
-
19
-
20
-
21
-
22
-
23
-
24
-
25
-
26
-
27
-
28
-
29
-
30
-
31
-
32
-
33
-
34
-
35
-
36
-
37
-
38
-
39
-
40
-
41
-
42
-
43
-
44
-
45
-
46
-
47
-
48
-
49
-
50
-
51
-
52
-
53
-
 54
54 -
 55
55 -
 56
56 -
 57
57 -
 58
58 -
 59
59 -
 60
60 -
 61
61 -
 62
62 -
 63
63 -
 64
64 -
 65
65 -
 66
66 -
 67
67 -
 68
68 -
 69
69 -
 70
70 -
 71
71 -
 72
72 -
 73
73 -
 74
74 -
75
-
76
-
77
-
78
-
79
-
80
-
81
-
82
-
83
-
84
-
85
-
86
-
87
-
88
-
89
-
90
-
91
-
92
-
93
-
94
-
95
-
96
-
97
-
98
-
99
-
100
-
101
-
102
-
103
-
104
-
105
-
106
-
107
-
108
-
109
-
110
-
111
-
112
-
113
-
114
-
115
-
116
-
117
-
118
-
119
-
120
-
121
-
122
-
123
-
124
-
125
-
126
-
127
-
128
 |
 |

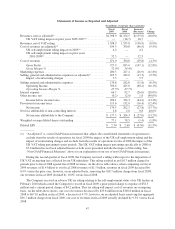
The table above shows that, including the impact of these charges, the Company’s fiscal 2009 gross profit
was
$
727.9 million, as com
p
ared to
$
835.0 million in fiscal 2008, a decrease of
$
107.1 million or 12.8%, an
d
that our gross profit margin of
5
2.0% declined 240 basis points from the prior year’s gross profit margin o
f
5
4.4%
.
I
n addition to the two adjustments for the UK tax rulings noted above, the Company recorded
$
5.5 million
o
f restructuring charges in fiscal 2009 associated with the cost savings initiatives announced in the first quarter o
f
f
iscal 2009. Selling, general and administrative expenses were 6.
5
% lower in fiscal 2009 versus fiscal 2008
.
Excluding the restructuring charges in fiscal 2009, selling, general and administrative expenses were
$
17.3
million, or 9.
5
%, lower than in fiscal 2008.
F
iscal 2009 operating income of
$
356.6 million declined
$
68.4 million, or 16.1%, from the fiscal 2008 level
o
f
$
425.0 million, and fiscal 2009 operating income margin declined to 25.5% compared to 27.7% in fiscal 2008.
Net income attributable to the Company of
$
177.3 million in fiscal 2009 was reduced by after-tax charges of
$
25.6 million related to the adverse UK tax ruling relating to the self-employment status of the Company’s U
K
leaders and
$
3.4 million for restructuring charges. Fiscal 2009 net income attributable to the Company declined
$
27.0 million, or 13.2%, from
$
204.3 million in fiscal 2008, which included after-tax charges of
$
12.7 million
f
or the adverse UK VAT ruling. Fiscal 2009 diluted earnings per share of
$
2.30, including
$
0.38 of decline for
the two fiscal 2009 items noted above, com
p
ared to
$
2.60 in fiscal 2008, which included
$
0.17 of decline related
to the fiscal 2008 charge noted above.
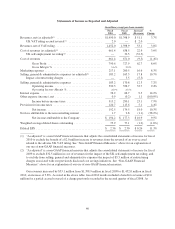
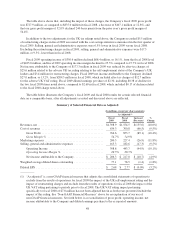
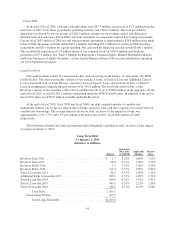
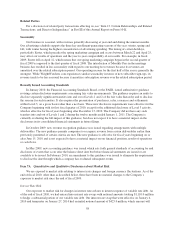
The table below illustrates the Company’s fiscal 2009 and fiscal 2008 results for certain selected financia
l
data on a comparable basis, after all adjustments as noted and discussed above are reflected.
S
ummar
y
of Selected Financial Data as Adjuste
d
(
In millions, exce
p
t
p
er share amounts
)
A
sAd
j
usted
(
1
)
Fi
sca
l
2009
Fi
sca
l
2008
Increase
/
(
Decrease
)
%
C
hang
e
R
evenues, net
.............................................
$
1,398.9 $1,554.5 $(155.6) (10.0%)
C
ost o
f
re
v
enues
..........................................
634.3 700.8 (66.5) (9.5%)
Gross Profi
t
..........................................
764.6 8
5
3.7 (89.1) (10.4%)
Gross Margin
%
......................................
5
4
.7
%
5
4
.
9%
Marketing expense
s
........................................
2
00.
5
227.4 (26.9) (11.8%)
Selling, general and administrative expenses
....................
1
6
5
.3 182.6 (17.3) (9.
5
%)
Operat
i
ng Incom
e
.
....................................
398
.
8 443
.7
(44
.
9) (10
.
1%)
O
perating Income Margin
%
............................
28
.5
%28
.5
%
N
et
i
ncome attr
ib
uta
bl
etot
h
e Compan
y
....................
$
2
06.3 $ 217.0 $ (10.7) (4.9%)
W
e
igh
te
d
avera
g
e
dil
ute
d
s
h
ares outstan
di
n
g
....................
77.1 78.5 (1.4) (1.8%)
Diluted EP
S
.
.............................................
$
2.68 $ 2.77 $ (0.09) (3.2%)
(1) “As adjusted” is a non-GAAP financial measure that adjusts the consolidated statements of operations to
exclude from the results of operations for fiscal 2009 the impact of the UK self-employment ruling and th
e
impact of restructuring charges and exclude from the results of operations for fiscal 2008 the impact of th
e
UK VAT ruling pertaining to periods prior to fiscal 2008. The UK VAT ruling impact pertainin
g
s
pecifically to fiscal 2008 of
$
7.8 million has not been adjusted herein as both years presented include th
e
impact of this ruling. See “Non-GAAP Financial Measures” above for an explanation of our use of
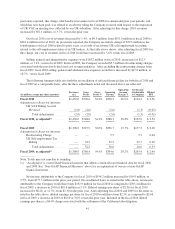
non-GAAP financial measures. Set forth below is a reconciliation of gross profit, operating income, net
income attributable to the Company and diluted earnings per share to the as reported amounts.
48