WeightWatchers 2010 Annual Report Download - page 58
Download and view the complete annual report
Please find page 58 of the 2010 WeightWatchers annual report below. You can navigate through the pages in the report by either clicking on the pages listed below, or by using the keyword search tool below to find specific information within the annual report.-
 1
1 -
2
-
3
-
4
-
5
-
6
-
7
-
8
-
9
-
10
-
11
-
12
-
13
-
14
-
15
-
16
-
17
-
18
-
19
-
20
-
21
-
22
-
23
-
24
-
25
-
26
-
27
-
28
-
29
-
30
-
31
-
32
-
33
-
34
-
35
-
36
-
37
-
38
-
39
-
40
-
41
-
42
-
43
-
44
-
45
-
46
-
47
-
 48
48 -
 49
49 -
 50
50 -
 51
51 -
 52
52 -
 53
53 -
 54
54 -
 55
55 -
 56
56 -
 57
57 -
 58
58 -
 59
59 -
 60
60 -
 61
61 -
 62
62 -
 63
63 -
 64
64 -
 65
65 -
 66
66 -
 67
67 -
 68
68 -
69
-
70
-
71
-
72
-
73
-
74
-
75
-
76
-
77
-
78
-
79
-
80
-
81
-
82
-
83
-
84
-
85
-
86
-
87
-
88
-
89
-
90
-
91
-
92
-
93
-
94
-
95
-
96
-
97
-
98
-
99
-
100
-
101
-
102
-
103
-
104
-
105
-
106
-
107
-
108
-
109
-
110
-
111
-
112
-
113
-
114
-
115
-
116
-
117
-
118
-
119
-
120
-
121
-
122
-
123
-
124
-
125
-
126
-
127
-
128
 |
 |
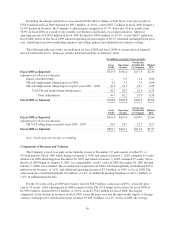
C
om
p
onents o
f
Revenue and Volume
s
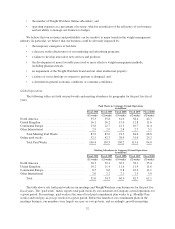
F
iscal 2010 volume and revenue performance trends improved over the course of the
y
ear after a weak firs
t
quarter. The stren
g
thenin
g
in performance was driven b
y
the NACO meetin
g
s business and acceleratin
gg
rowth
in Wei
g
htWatchers.com. Partiall
y
offsettin
gg
rowth in these businesses was weak performance throu
g
hout the
y
ear in the UK meetin
g
s business and a slowdown in
g
rowth in Continental Europe
.
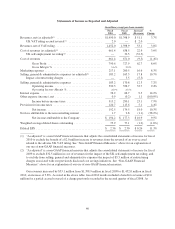
F
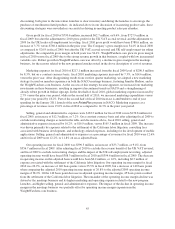
or the full year of fiscal 2010, net revenues were
$
1,452.0 million, an increase of
$
53.1 million, or 3.8%
,
o
ver
$
1,398.9 million in the prior fiscal year. After the
$
2.0 million adjustment to 2010 revenues for the UK
VAT accrual reversal noted in the table and discussions above, fiscal 2010 net revenues were
$
1,450.0 million
,
an increase of 3.7% versus prior year. Favorable foreign currency exchange rates increased our revenues fo
r
f
iscal 2010 by
$
4.0 million, or 0.3%. In the first quarter 2010, adjusted net revenues fell short of first quarte
r
2009 levels as a result of a combination of factors. In the US and UK meetings businesses, which were cyclin
g
against a prior year innovation, ineffective marketing in the first quarter 2010 failed to draw enrollments into our
meetings, and very poor weather conditions resulted in some meeting closures and lowered the propensity of our
members to attend open meetings in weather-affected areas
.
T
h
es
h
ort
f
a
ll i
n
fi
rst quarter 2010 net revenues versus t
h
epr
i
or
y
ear per
i
o
d
was more t
h
an o
ff
set
by g
rowt
h
i
n net revenues
i
nt
h
e
l
ast n
i
ne mont
h
so
ffi
sca
l
2010 versus t
h
e respect
i
ve pr
i
or
y
ear per
i
o
d
,
d
r
i
ven
by i
ncrease
s
i
nt
h
e NACO meet
i
n
g
s
b
us
i
ness an
d
We
igh
tWatc
h
ers.com, w
hi
c
h
o
ff
set on
g
o
i
n
g
wea
k
ness
i
nt
h
e UK meet
i
n
gs
b
us
i
ness. A c
h
an
g
e
i
n mar
k
et
i
n
g
strate
gy i
nt
h
e secon
d
quarter 2010
i
nt
h
e NACO meet
i
n
g
s
b
us
i
ness an
di
nt
h
e
W
e
igh
tWatc
h
ers.com
b
us
i
ness spurre
d
an
i
mprovement
i
nvo
l
ume tren
d
s
i
n NACO an
d
ro
b
ust
g
rowt
hi
nWe
ight
W
atc
h
ers On
li
ne s
ig
n-ups. T
h
e
i
mprov
i
n
g
tren
di
nt
h
ese two
b
us
i
nesses cont
i
nue
d
t
h
rou
gh
out t
h
e rest o
f
t
h
e
y
ear,
an
d
was
f
urt
h
er compoun
d
e
dby
t
h
e
f
avora
bl
e
i
mpact on vo
l
umes an
d
revenues o
f
t
h
e success
f
u
ll
aunc
h
o
f
our
new pro
g
rams,
P
ointsPlus
a
n
d
ProPoint
s
,
as app
li
ca
bl
e,
i
n Novem
b
er 2010
i
n our En
gli
s
h
-spea
ki
n
g
mar
k
ets.
F
or fiscal 2010,
g
lobal meetin
g
fees were $819.6 million, an increase of $2.1 million, or 0.3%, from $817.5
million in the prior
y
ear period. After the $2.0 million ad
j
ustment to 2010
g
lobal meetin
g
fees for the UK VA
T
accrual reversal noted in the table and discussions above, fiscal 2010
g
lobal meetin
g
fees would have been
$
817.6 million, up less than $0.1 million versus prior
y
ear. Excludin
g
favorable forei
g
n currenc
y
exchan
g
e rates
,
which increased our
g
lobal meetin
g
fees for fiscal 2010 b
y
$1.8 million, or 0.2%,
g
lobal meetin
g
fees, a
s
ad
j
usted for the UK VAT accrual reversal, declined sli
g
htl
y
versus prior
y
ear b
y
0.2%. The lack of increase i
n
g
lobal meetin
g
fees on a constant currenc
y
basis was the result of weak enrollment earl
y
in the
y
ear in NACO
meetin
g
s and throu
g
hout the
y
ear in UK meetin
g
s, which held full
y
ear
g
lobal meetin
g
paid weeks at virtuall
y
the
same level as the prior
y
ear, up
j
ust 0.4%. In Continental Europe, the launch of our ne
w
Pr
o
P
oi
nt
s
p
ro
g
ram
innovation at the end of fiscal 2009 resulted in enrollment and meetin
g
fees increases throu
g
hout the first half of
f
iscal 2010 versus prior
y
ear; however, the
g
rowth was offset b
y
declines versus prior
y
ear in the second half of
f
iscal 2
0
1
0
in this market
.
Global meeting paid weeks increased by 0.3 million, or 0.4%, in fiscal 2010 to 87.9 million versu
s
8
7.6 million in the prior year period. After a decline of 4.2% in the first quarter 2010 versus first quarter 2009
,
global meeting paid weeks performance steadily improved across the rest of the 2010 fiscal year. Versus the prio
r
y
ear comparable periods, global meeting paid weeks were up 0.8% in the second quarter, 2.6% in the third
q
uarter, and 3.0% in the fourth quarter, primarily as a result of improvements in the NACO business.
Global attendance in our meetin
g
s decreased b
y
6.1% in fiscal 2010 to 51.0 million from 54.3 million i
n
fi
sca
l
2009,
d
r
i
ven
by
t
h
e 12.0% atten
d
ance
d
ec
li
ne t
h
at we exper
i
ence
di
nt
h
e
fi
rst quarter 2010 versus t
h
e
fi
rst
q
uarter 2009. As note
d
a
b
ove, extreme weat
h
er
i
n man
y
o
f
our
g
eo
g
rap
hi
es
i
nt
h
e
fi
rst quarter 2010 resu
l
te
din
s
ome meet
i
n
g
c
l
osures an
dl
owere
d
t
h
e propens
i
t
y
o
f
our mem
b
ers to atten
d
meet
i
n
g
s. In a
ddi
t
i
on, as note
d
a
b
ove,
d
ur
i
n
g
t
h
e
fi
rst quarter 2010, t
h
eUSan
d
UK meet
i
n
g
s
b
us
i
nesses were c
y
c
li
n
g
a
g
a
i
nst a pr
i
or
y
ear
p
ro
g
ram
i
nnovat
i
on. T
h
e
gl
o
b
a
l
atten
d
ance
d
ec
li
ne
l
essene
di
nt
h
e secon
d
an
d
t
hi
r
d
quarters o
ffi
sca
l
2010 versus
t
h
e compara
bl
epr
i
or
y
ear per
i
o
d
s, an
d
near
ly
ac
hi
eve
d
par
i
t
y
w
i
t
h
t
h
epr
i
or
y
ear per
i
o
di
nt
h
e
f
ourt
h
quarter
,
d
own
j
ust 0.8% as a resu
l
to
f
NACO’s per
f
ormance.
42