WeightWatchers 2010 Annual Report Download - page 56
Download and view the complete annual report
Please find page 56 of the 2010 WeightWatchers annual report below. You can navigate through the pages in the report by either clicking on the pages listed below, or by using the keyword search tool below to find specific information within the annual report.-
 1
1 -
2
-
3
-
4
-
5
-
6
-
7
-
8
-
9
-
10
-
11
-
12
-
13
-
14
-
15
-
16
-
17
-
18
-
19
-
20
-
21
-
22
-
23
-
24
-
25
-
26
-
27
-
28
-
29
-
30
-
31
-
32
-
33
-
34
-
35
-
36
-
37
-
38
-
39
-
40
-
41
-
42
-
43
-
44
-
45
-
 46
46 -
 47
47 -
 48
48 -
 49
49 -
 50
50 -
 51
51 -
 52
52 -
 53
53 -
 54
54 -
 55
55 -
 56
56 -
 57
57 -
 58
58 -
 59
59 -
 60
60 -
 61
61 -
 62
62 -
 63
63 -
 64
64 -
 65
65 -
 66
66 -
67
-
68
-
69
-
70
-
71
-
72
-
73
-
74
-
75
-
76
-
77
-
78
-
79
-
80
-
81
-
82
-
83
-
84
-
85
-
86
-
87
-
88
-
89
-
90
-
91
-
92
-
93
-
94
-
95
-
96
-
97
-
98
-
99
-
100
-
101
-
102
-
103
-
104
-
105
-
106
-
107
-
108
-
109
-
110
-
111
-
112
-
113
-
114
-
115
-
116
-
117
-
118
-
119
-
120
-
121
-
122
-
123
-
124
-
125
-
126
-
127
-
128
 |
 |

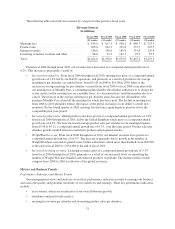
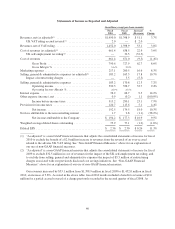
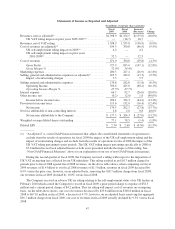
Statements of Income as Re
p
orted and Adjusted
(
In millions, exce
p
t
p
er share amounts
)
Fiscal
2010
Fiscal
2009
Increase
/
(
Decrease
)
%
C
hang
e
R
evenues, net (as a
dj
uste
d
)
(1)
...............................
$
1,450.0 $1,398.9 $ 51.1 3.7
%
UK VAT ru
li
n
g
accrua
l
reversa
l
(1)
.
...................... 2.0 — $ 2.0
R
evenues, net of VAT ruling
................................
1
,4
5
2.0 1,398.9
5
3.1 3.8%
Cost o
f
revenues (as a
dj
uste
d)
(
2
)
.
............................ 661.4 638.5 22.9 3.6%
UK se
lf
-emp
l
o
y
ment tax ru
li
n
g
(
2
)
........................ —
3
2.5
(
32.5
)
C
ost o
f
re
v
enues
.........................................
661.4 671.0 (9.5) (1.4%
)
G
ross Profit
.....................................
7
9
0.
6
727.
96
2.7 8.
6
%
G
ross Margin
%
.................................
54.4% 52.0
%
Marketing expense
s
.......................................
2
17.1 200.
5
16.6 8.3%
Selling, general & administrative expenses (as adjusted
)
(
2
)
........
1
83.2 16
5
.3 17.8 10.7%
I
mpact of restructuring charge
s
.......................... —
5
.
5
(5
.
5)
Se
lli
ng, genera
l
&a
d
m
i
n
i
strat
i
ve expense
s
....................
183
.
21
7
0
.
812
.
3
7.
2%
O
perat
i
ng
i
ncome
................................
390.3 3
5
6.7 33.7 9.4%
Operating Income Margin
%
........................
26
.9% 25.5
%
I
nterest expense
..........................................
76.2 66.7 9.
5
14.2%
Ot
h
er expense (
i
ncome), ne
t
................................
0
.
9
(0
.
2) 1
.
1 (100
.
0%)
Income
b
e
f
ore
i
ncome taxes
........................
313.2 290.1 23.1 7.9%
Pro
vi
s
i
on
f
or
i
ncome taxes
.................................
1
2
0
.7 11
5
.
65
.1 4.4%
Net income
......................................
19
2.
5
174.
5
18.0 10.3%
Net loss attributable to the noncontrolling interest ...............
1
.7
2
.
8
(1
.
1) (38
.
2%)
Net
i
ncome attr
ib
uta
bl
etot
h
e Company ...............
$
1
94.2
$
177.3
$
16.9 9.5%
W
e
i
g
h
te
d
average
dil
ute
d
s
h
ares outstan
di
n
g
.
.................. 7
5
.9 77.1
(
1.2
)(
1.6%
)
D
il
ute
d
EPS .............................................
$
2.56
$
2.30
$
0.26 11.3%
(1) “As adjusted” is a non-GAAP financial measure that adjusts the consolidated statements of income for fisca
l
2
010 to exclude the benefit of a
$
2.0 million increase to revenues from the reversal of an over-accrua
l
related to the adverse UK VAT ruling. See “Non-GAAP Financial Measures” above for an explanation o
f
our use of non-GAAP financial measures
.
(2) “As adjusted” is a non-GAAP financial measure that adjusts the consolidated statements of income for fisca
l
2
009 to exclude
$
32.5 million in cost of revenues for the impact of the UK self-employment tax ruling, and
to exclude from selling, general and administrative expenses the impact of
$
5.5 million of restructuring
charges associated with our previously disclosed cost savings initiatives. See “Non-GAAP Financial
M
easures” above for an ex
p
lanation of our use of non-GAAP financial measures.
Our revenues increased by
$
53.1 million from
$
1,398.9 million in fiscal 2009 to
$
1,452.0 million in fisca
l
2010, an increase of 3.8%. As noted in the above table, fiscal 2010 results included a benefit to revenue of
$
2.
0
million for a partial accrual reversal of a charge previously recorded in the second quarter of fiscal 2008. A
s
40