WeightWatchers 2010 Annual Report Download - page 69
Download and view the complete annual report
Please find page 69 of the 2010 WeightWatchers annual report below. You can navigate through the pages in the report by either clicking on the pages listed below, or by using the keyword search tool below to find specific information within the annual report.-
 1
1 -
2
-
3
-
4
-
5
-
6
-
7
-
8
-
9
-
10
-
11
-
12
-
13
-
14
-
15
-
16
-
17
-
18
-
19
-
20
-
21
-
22
-
23
-
24
-
25
-
26
-
27
-
28
-
29
-
30
-
31
-
32
-
33
-
34
-
35
-
36
-
37
-
38
-
39
-
40
-
41
-
42
-
43
-
44
-
45
-
46
-
47
-
48
-
49
-
50
-
51
-
52
-
53
-
54
-
55
-
56
-
57
-
58
-
 59
59 -
 60
60 -
 61
61 -
 62
62 -
 63
63 -
 64
64 -
 65
65 -
 66
66 -
 67
67 -
 68
68 -
 69
69 -
 70
70 -
 71
71 -
 72
72 -
 73
73 -
 74
74 -
 75
75 -
 76
76 -
 77
77 -
 78
78 -
 79
79 -
80
-
81
-
82
-
83
-
84
-
85
-
86
-
87
-
88
-
89
-
90
-
91
-
92
-
93
-
94
-
95
-
96
-
97
-
98
-
99
-
100
-
101
-
102
-
103
-
104
-
105
-
106
-
107
-
108
-
109
-
110
-
111
-
112
-
113
-
114
-
115
-
116
-
117
-
118
-
119
-
120
-
121
-
122
-
123
-
124
-
125
-
126
-
127
-
128
 |
 |
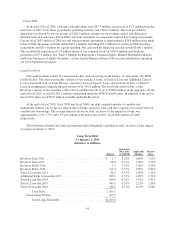
including
$
40.5 million of cash and cash equivalents and
$
197.5 million of current portion of long-term debt.
T
his compared to a working capital deficit at January 2, 2010 of
$
336.1 million, which included
$
46.1 million of
cash and cash equivalents and
$
215.0 million of current portion of long-term debt. Excluding the changes in cas
h
and cash equivalents and in the current portion of long-term debt from both periods, the working capital deficit a
t
January 1, 2011 was
$
191.7 million, an increase of
$
24.5 million versus
$
167.2 million at January 2, 2010
.
The
$
24.5 million growth in the working capital deficit in fiscal 2010 versus the fiscal 2009 level, excluding
the changes in cash and cash equivalents and the current portion of long-term debt, was comprised of increases in
o
perational and other accrued items in fiscal 2010, partially offset by significant payments in fiscal 2009 for a
charge associated with the adverse UK VAT ruling accrued in a prior period. The net increase in the workin
g
capital deficit in fiscal 2010 from operational items, including receivables, inventory, accrued expenses and
p
ayables was
$
47.4 million. This increase resulted primarily from the combination of higher accrued operating
expenses of
$
24.6 million, a shift in the timing of tax payments of
$
17.6 million, and a
$
5.2 million increase in
deferred revenue. The higher accrued operating expenses in fiscal 2010 resulted from marketing and cor
e
materials expense increases in connection with the new program launches in our English-speaking markets, a
shift in the timing of salary payments, and higher accrued performance-based compensation. The working capital
deficit also increased in fiscal 2010 as a result of the addition of accrued ex
p
ense of
$
6.5 million for the
settlement of the California labor litigation, and for the addition of
$
4.1 million to the liability related to the
p
reviously mentioned adverse UK self-employment tax ruling to cover the fiscal 2010 portion of that expense. In
f
iscal 2010, payments totaling
$
31.6 million were made in relation to the accrued liability associated with th
e
p
reviously mentioned adverse UK VAT ruling, thereby decreasing the working capital deficit in fiscal 2010
.
S
ources and Uses of Cas
h
F
i
s
cal 201
0
A
t the end of fiscal 2010, cash and cash e
q
uivalents were
$
40.5 million, a decrease of
$
5.6 million from the
end of fiscal 2009. Cash flows provided by operating activities increased by
$
15.9 million in fiscal 2010 to
$
281.4 million from
$
265.5 million in fiscal 2009, largely reflecting the increase in net income of
$
16.9 millio
n
in fiscal 2010, to
$
194.2 million from
$
177.3 million in fiscal 2009
.
The
$
281.4 million of cash flows provided by operating activities in fiscal 2010 exceeded fiscal 2010’s
$
194.2 million net income by
$
87.2 million. The excess of cash over net income arose primarily from differences
between book and cash taxes and other elements of the working capital deficit, as well as from typical non-cash
depreciation and amortization expenses. Net cash used for investing and financing activities combined totale
d
$
285.5 million in fiscal 2010. Investing activities, consisting primarily of capital spending, utilized
$
28.6 million.
Capital spending, which totaled
$
22.2 million in fiscal 2010, has averaged approximately
$
25.7 million annuall
y
o
ver the last three fiscal years and has consisted primarily of information system and website developmen
t
expenditures, leasehold improvements, furniture and equipment for meeting locations. Net cash used for
f
inancing activities totaled
$
256.9 million and consisted primarily of stock repurchases of
$
106.6 million and
dividend payments to our shareholders of
$
53.4 million, as well as long-term debt payments of
$
87.9 million
.
F
iscal 2009
A
t the end of fiscal 2009, cash and cash e
q
uivalents were
$
46.1 million, a decrease of
$
1.2 million from the
end of fiscal 2008. Cash flows provided by operating activities were
$
265.5 million, exceeding fiscal 2009 ne
t
income of
$
177.3 million by
$
88.2 million. The excess of cash over net income arose primarily from differences
between book and cash taxes and typical non-cash depreciation and amortization expenses. Net cash used for
investing and financing activities combined totaled
$
270.6 million. Investing activities, consisting primarily o
f
capital spending, utilized
$
23.6 million. Net cash used for financing activities totaled
$
247.0 million, includin
g
dividend payments of
$
54.1 million and long-term debt payments of
$
194.5 million.
5
3