WeightWatchers 2010 Annual Report Download - page 65
Download and view the complete annual report
Please find page 65 of the 2010 WeightWatchers annual report below. You can navigate through the pages in the report by either clicking on the pages listed below, or by using the keyword search tool below to find specific information within the annual report.-
 1
1 -
2
-
3
-
4
-
5
-
6
-
7
-
8
-
9
-
10
-
11
-
12
-
13
-
14
-
15
-
16
-
17
-
18
-
19
-
20
-
21
-
22
-
23
-
24
-
25
-
26
-
27
-
28
-
29
-
30
-
31
-
32
-
33
-
34
-
35
-
36
-
37
-
38
-
39
-
40
-
41
-
42
-
43
-
44
-
45
-
46
-
47
-
48
-
49
-
50
-
51
-
52
-
53
-
54
-
 55
55 -
 56
56 -
 57
57 -
 58
58 -
 59
59 -
 60
60 -
 61
61 -
 62
62 -
 63
63 -
 64
64 -
 65
65 -
 66
66 -
 67
67 -
 68
68 -
 69
69 -
 70
70 -
 71
71 -
 72
72 -
 73
73 -
 74
74 -
 75
75 -
76
-
77
-
78
-
79
-
80
-
81
-
82
-
83
-
84
-
85
-
86
-
87
-
88
-
89
-
90
-
91
-
92
-
93
-
94
-
95
-
96
-
97
-
98
-
99
-
100
-
101
-
102
-
103
-
104
-
105
-
106
-
107
-
108
-
109
-
110
-
111
-
112
-
113
-
114
-
115
-
116
-
117
-
118
-
119
-
120
-
121
-
122
-
123
-
124
-
125
-
126
-
127
-
128
 |
 |

E
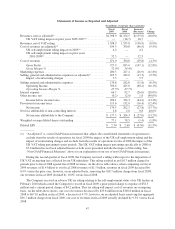
xcluding the charges noted above associated with the UK tax rulings in both fiscal years, gross profit o
f
$
764.6 million in fiscal 2009 declined by
$
89.1 million, or 10.4%, versus
$
853.7 million in fiscal 2008. Despite
a
10.0% decline in revenues, the Company’s adjusted gross margin was
5
4.7%, down just 20 basis points fro
m
5
4.9% in fiscal 2008 as a result of our variable cost business model and cost savings initiatives. Adjuste
d
o
perating income of
$
398.8 million in fiscal 2009 declined by
$
44.9 million, or 10.1%, versus
$
443.7 million in
f
iscal 2008; however, the fiscal 2009 adjusted operating income margin of 28.
5
% remained unchanged from prio
r
y
ear, benefiting from lower marketing expenses and selling, general and administrative expense savings.
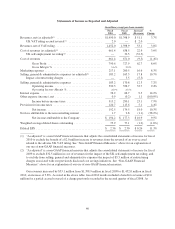
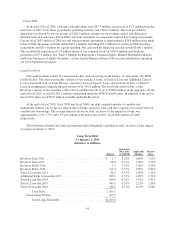
The following table sets forth a reconciliation for fiscal 2009 and fiscal 2008 of certain selected financial
data set forth in the above “Summary of Selected Financial Data as Adjusted” table
:
(
In millions, exce
p
t
p
er share amounts
)
G
ros
s
Pr
o
fit
O
perat
i
n
g
In
co
m
e
N
et
I
ncom
e
A
ttr
i
butabl
e
to Company
D
i
lute
d
E
P
S
F
i
scal 2009 as Reported .....................................
$
727.9
$
356.6
$
177.3
$
2.3
0
A
dj
ustments to Reporte
d
Amount
s
I
mpact o
f
restructur
i
n
g
................................... —
5
.
5
3.4
0
.
04
UK se
lf
-emp
l
oyment ru
li
ng
i
mpact on 200
9
.
.................
4
.
24
.
22
.
9
0
.
04
UK self-employment ruling impact on prior years 2001 - 2008 . . . 32.
5
32.
5
22.7 0.29
T
ota
l
UK se
lf
-emp
l
o
y
ment ru
li
n
gi
mpac
t
................
36
.7
36
.7 2
5
.
60
.
33
T
otal Adjustments
..............................
36.7 42.2 2
9
.0 0.3
8
F
i
scal 2009 as Ad
j
uste
d
.....................................
$
764.6
$
398.8
$
206.3
$
2.6
8
G
ros
s
Pro
fi
t
O
perat
i
n
g
I
ncome
N
et Incom
e
A
ttr
i
butabl
e
to
C
ompany
D
i
lute
d
E
P
S
Fiscal 2008 as Reported
.....................................
$835.0 $425.0 $204.3 $2.6
0
A
d
justments to Reporte
d
Amount
s
UK VAT rulin
g
impact on prior
y
ears 2005 - 2007
.............
18
.7 1
8
.7 12.7
0
.1
7
F
i
scal 2008 as Ad
j
uste
d
.....................................
$
853.7
$
443.7
$
217.0
$
2.7
7
Note: Totals may not sum due to rounding
.
C
om
p
onents o
f
Revenue and Volume
s
The Company’s fiscal year ends on the Saturday closest to December 3
1
st
a
nd consists of either
5
2- o
r
5
3-week periods. Fiscal 2009 which began on January 4, 2009 and ended on January 2, 2010 contained
5
2 weeks
,
while fiscal 2008 which began on December 30, 2007 and ended on January 3, 2009 contained
5
3 weeks. Give
n
that fiscal 2009 began on January 4, 2009, for comparability, week 1 of fiscal 2008 (December 30, 2007 through
January 5, 2008) was excluded. The excluded extra week in fiscal 2008 contributed globally an additional
$
15.
8
million in net revenues, or 1.0%, and additional operating income of
$
3.3 million, or 0.8%, to fiscal 2008. Th
e
extra week also contributed globally 0.
6
million, or 1.0%, in additional meeting attendances and 1.3 million, or
1.4%, in additional
p
aid weeks
.
F
or the 52 weeks of fiscal 2009 net revenues were
$
1,398.9 million, a decrease of 8.9%, versus the
p
rior
y
ear of
5
3 weeks. After adjusting fiscal 2008 revenues for the UK VAT ruling, net revenues for fiscal 2009 of
$
1,398.9 million, declined
$
155.6 million, or 10.0%, from
$
1,554.5 million for fiscal 2008. The largest
component of this decline in revenues in fiscal 2009 versus the prior year was the unfavorable impact of foreig
n
currency exchange rates, which reduced our revenues by
$
63.9 million, or 4.1%. In fiscal 2009, the averag
e
49