WeightWatchers 2010 Annual Report Download - page 67
Download and view the complete annual report
Please find page 67 of the 2010 WeightWatchers annual report below. You can navigate through the pages in the report by either clicking on the pages listed below, or by using the keyword search tool below to find specific information within the annual report.-
 1
1 -
2
-
3
-
4
-
5
-
6
-
7
-
8
-
9
-
10
-
11
-
12
-
13
-
14
-
15
-
16
-
17
-
18
-
19
-
20
-
21
-
22
-
23
-
24
-
25
-
26
-
27
-
28
-
29
-
30
-
31
-
32
-
33
-
34
-
35
-
36
-
37
-
38
-
39
-
40
-
41
-
42
-
43
-
44
-
45
-
46
-
47
-
48
-
49
-
50
-
51
-
52
-
53
-
54
-
55
-
56
-
 57
57 -
 58
58 -
 59
59 -
 60
60 -
 61
61 -
 62
62 -
 63
63 -
 64
64 -
 65
65 -
 66
66 -
 67
67 -
 68
68 -
 69
69 -
 70
70 -
 71
71 -
 72
72 -
 73
73 -
 74
74 -
 75
75 -
 76
76 -
 77
77 -
78
-
79
-
80
-
81
-
82
-
83
-
84
-
85
-
86
-
87
-
88
-
89
-
90
-
91
-
92
-
93
-
94
-
95
-
96
-
97
-
98
-
99
-
100
-
101
-
102
-
103
-
104
-
105
-
106
-
107
-
108
-
109
-
110
-
111
-
112
-
113
-
114
-
115
-
116
-
117
-
118
-
119
-
120
-
121
-
122
-
123
-
124
-
125
-
126
-
127
-
128
 |
 |
in-meeting product sales in total declined 11.0%, or
$
15.7 million, versus fiscal 2008, to
$
126.7 million, due i
n
f
ull to lower attendances, as product sales per attendee in NACO rose 0.9%. Internationally, in-meeting product
sales per attendee declined 7.
5
% over the prior year but grew
5
.1% on a constant currency basis, despite lower
in-meeting product sales per attendee in Continental Europe resulting from our planned run down of inventory i
n
p
reparation for the launch of our new program innovation. The growth was driven by the United Kingdom, wher
e
p
roduct sales were especially strong, increasing by 12.0% on a constant currency basis. International product
sales in total were
$
137.6 million in fiscal 2009 versus
$
162.7 million in the prior year, down 3.5% on a constant
currency basis.
I
nternet revenues, which include subscription revenues from Weight Watchers Online and Weight Watchers
eTools as well as Internet advertising revenues, grew
$
10.2 million, or 5.5%, to
$
196.0 million for fiscal 2009
f
rom
$
185.8 million for fiscal 2008. On a constant currency basis, fiscal 2009 Internet revenues rose 8.1% versu
s
the prior year. Online sign-up growth decelerated in the United States in fiscal 2009 versus the prior year
,
r
eflecting both the impact of low consumer confidence in 2009 and higher Online sign-up growth in the prio
r
y
ear. Internationally, Online sign-up growth was driven by successful marketing campaigns and promotions.
End-of-period active Weight Watchers Online subscribers increased 12.4%, from
6
79,000 at January 3, 2009 t
o
76
3,000 at January 2, 2010.
Other revenue, comprised primarily of licensing revenues and revenues from our publications, was
$
80.2
million for fiscal 2009, a decrease of
$
5.7 million, or 6.6%, from
$
85.9 million in fiscal 2008. Excluding th
e
negative impact of foreign currency, other revenue decreased
$
1.5 million in fiscal 2009 versus the prior year.
Our fiscal 2009 global licensing revenues, which decreased 4.1%, increased 1.0% on a constant currency basi
s
versus fiscal 2008 on the strength of the UK licensing business. Economic conditions have tempered growth i
n
o
ur licensing business elsewhere during fiscal 2009. In the United States, licensing revenues were impacted b
y
two historically significant deals. In one case, we restructured a contract with a major licensing partner and
r
educed minimum payments. In another case, we had a significant fall off in revenues from a license partner who
r
ecently had an ownership change
.
F
ranchise royalties for fiscal 2009 were
$
8.4 million in the United States and
$
4.7 million internationally
.
T
otal franchise royalties of
$
13.1 million were 19.2% lower in fiscal 2009 versus the prior year, or 17.0% lower
in constant currency. Excluding lost commissions resulting from franchise acquisitions which occurred during
f
iscal 2008, franchise royalties for fiscal 2009 declined 14.
6
% on a constant currency basis versus the prior year
,
with demonstrable impact from the weakened US economy
.
C
omponents o
f
Expenses and Marg
i
n
s
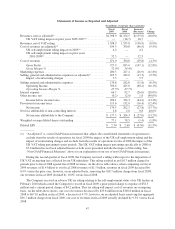
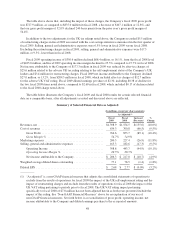
Cost of revenues was
$
671.0 million for fiscal 2009, a decrease of
$
29.8 million, or 4.3%, from
$
700.8
million for fiscal 2008. The decrease was driven by lower meeting attendances. As noted above, fiscal 2009 cos
t
o
f revenues included an aggregate charge of
$
36.7 million related to the adverse UK tax ruling relating to the
self-employment status of the Company’s UK leaders which increased 2009 cost of revenues by
5
.2% over prior
y
ear, and diluted fiscal 2009 gross profit margin by 270 basis points. Including the impact of the UK self-
employment tax ruling in fiscal 2009 and the UK VAT ruling in fiscal 2008, the gross profit margins in fiscal
2009 and fiscal 2008 were
5
2.0% and
5
4.4%, respectively. Excluding the charge related to the UK self
-
employment tax ruling, the fiscal 2009 gross profit margin was
5
4.7%. This compared to the fiscal 2008 gross
p
rofit margin of
5
4.9% excluding the
5
0 basis point negative impact of the previously mentioned 2008 UK VAT
r
uling. On this comparable basis, the
5
4.7% gross margin in fiscal 2009 was just 20 basis points below
5
4.9% in
f
iscal 2008 with the decline resulting from lower attendance per meeting and in-meeting product promotions. Our
variable cost business model prevented deeper margin compression in fiscal 2009 despite the impact of the globa
l
r
ecessionary economy on our volumes and revenues
.
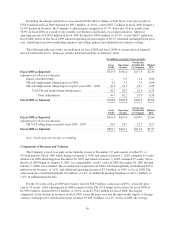
M
arketing expenses for fiscal 2009 decreased
$
26.9 million, or 11.8%, to
$
200.5 million from
$
227.4
million for fiscal 2008. Marketing expenses as a percentage of revenues declined to 14.3% in fiscal 2009 as
51