WeightWatchers 2010 Annual Report Download - page 60
Download and view the complete annual report
Please find page 60 of the 2010 WeightWatchers annual report below. You can navigate through the pages in the report by either clicking on the pages listed below, or by using the keyword search tool below to find specific information within the annual report.-
 1
1 -
2
-
3
-
4
-
5
-
6
-
7
-
8
-
9
-
10
-
11
-
12
-
13
-
14
-
15
-
16
-
17
-
18
-
19
-
20
-
21
-
22
-
23
-
24
-
25
-
26
-
27
-
28
-
29
-
30
-
31
-
32
-
33
-
34
-
35
-
36
-
37
-
38
-
39
-
40
-
41
-
42
-
43
-
44
-
45
-
46
-
47
-
48
-
49
-
 50
50 -
 51
51 -
 52
52 -
 53
53 -
 54
54 -
 55
55 -
 56
56 -
 57
57 -
 58
58 -
 59
59 -
 60
60 -
 61
61 -
 62
62 -
 63
63 -
 64
64 -
 65
65 -
 66
66 -
 67
67 -
 68
68 -
 69
69 -
 70
70 -
71
-
72
-
73
-
74
-
75
-
76
-
77
-
78
-
79
-
80
-
81
-
82
-
83
-
84
-
85
-
86
-
87
-
88
-
89
-
90
-
91
-
92
-
93
-
94
-
95
-
96
-
97
-
98
-
99
-
100
-
101
-
102
-
103
-
104
-
105
-
106
-
107
-
108
-
109
-
110
-
111
-
112
-
113
-
114
-
115
-
116
-
117
-
118
-
119
-
120
-
121
-
122
-
123
-
124
-
125
-
126
-
127
-
128
 |
 |
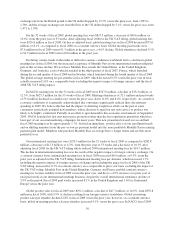
Global in-meeting product sales for fiscal 2010 were
$
260.5 million, an increase of
$
9.1 million, or 3.6%,
f
rom
$
251.3 million in fiscal 2009. On a per attendee basis, global in-meeting product sales increased 10.3% i
n
f
iscal 2010 versus the prior year period, or 10.2% on a constant currency basis. In-meeting product sales growth
was driven primarily by program innovations which drove strong sales per attendee in Continental Europe in th
e
f
irst quarter and in the English-speaking countries in the fourth quarter. In NACO, fiscal 2010 full year
in-meeting product sales of
$
138.8 million increased by
$
12.1 million, or 9.5%, versus the prior year on the
strength of 1
6
.2% per attendee sales growth. In the fourth quarter, NACO’s in-meeting product sales per attende
e
r
ose 37% over the prior year fourth quarter, reflecting the impact of the new program launch. International
in-meeting product sales were
$
121.7 million in fiscal 2010, a decrease of 2.3%, or 2.0% on a constant currenc
y
basis, versus the prior year. International in-meeting product sales per attendee increased 4.
5
% in fiscal 2010
versus the prior year, and increased 4.9% on a constant currency basis. UK in-meeting product sales per attendee
r
ose 46.6%, or
5
2.3% on a constant currency basis, in the fourth quarter 2010 versus the fourth quarter 2009, als
o
r
eflecting the impact of its new program launch
.
I
nternet revenues, which include subscription revenues from sales of Weight Watchers Online and Weight
W
atchers eTools as well as Internet advertising revenues, increased
$
42.8 million, or 21.8%, to
$
238.8 million
f
or fiscal 2010 from
$
196.0 million for fiscal 2009. The increase was driven by strong growth and an acceleratin
g
trend in Online sign-ups throughout the year. Internet revenue growth accelerated in the second quarter of 2010
by 20.
6
% versus the prior year period led by a highly successful marketing strategy in the United States.
B
usiness
p
erformance continued to im
p
rove with a 21.7% increase in Internet revenues in the third
q
uarter of
f
iscal 2010 as compared to the prior year period. With the new program launch in our English-speaking markets
,
f
ourth quarter Internet revenues grew by 31.1% versus the prior year period. In addition, WeightWatchers.co
m
launched its two Internet subscription products in Sweden in the fourth quarter of fiscal 2009 and Belgium and
S
p
ain in the fourth
q
uarter of fiscal 2010. End-of-
p
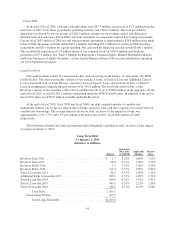
eriod active Online subscribers increased 38.2% from 763,00
0
at January 2, 2010 to 1,0
5
4,000 at January 1, 2011
.
Other revenues, comprised primarily of licensing revenues and revenues from our publications, were
$
121.0
million for both fiscal 2010 and fiscal 2009, but were flat in fiscal 2010 as com
p
ared to fiscal 2009 or down 0.6%
o
n a constant currency basis. Our global licensing revenues in fiscal 2010 decreased
5
.0% versus the prior yea
r
p
eriod. Licensing in the premium priced “better-for-you” category which encompasses our licensees continues t
o
be impacted negatively by changes in consumer discretionary spending which resulted from the economic
r
ecession. NACO licensing revenues declined 3.7% in fiscal 2010 versus fiscal 2009, and International licensing
r
evenues declined by 6.2%, or 6.
5
% on a constant currency basis, in fiscal 2010 versus fiscal 2009.
F
ranchise royalties for fiscal 2010 were
$
7.8 million in the United States and
$
4.3 million internationally
.
T
otal franchise royalties of
$
12.1 million were 7.2% lower in fiscal 2010 versus the prior year, and 7.8% lower
o
n a constant currency basis, underperforming as compared to the Company-owned meetings business. Whil
e
North American franchise royalties declined by 6.9% on a full year basis in fiscal 2010 versus fiscal 2009, the
new program introduction in November 2010 drove franchise royalties up 10.2% in the fourth quarter 201
0
versus the com
p
arable 2009
p
eriod
.
C
omponents o
f
Expenses and Marg
i
n
s
F
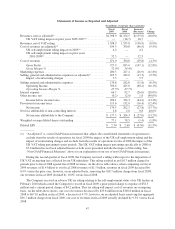
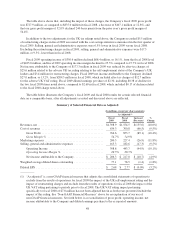
or fiscal 2010, cost of revenues was
$
661.4 million, a decrease of
$
9.5 million, or 1.4%, from
$
671.0
million in the prior year. After adjusting fiscal 2009 cost of revenues for the
$
32.5 million charge associated wit
h
the UK self-employment tax ruling as noted above, fiscal 2009 cost of revenues would have been
$
638.5 million,
and fiscal 2010 cost of revenues would have increased by
$
22.9 million, or 3.6%, versus the prior year. The 201
0
cost of revenues overall increased versus the prior year at the same rate as revenues. In the meetings business
,
however, growth in the cost of revenues exceeded revenue growth. This was primarily the result of two factors,
both related to the launch of our new programs in the English speaking markets. First was the incremental cost o
f
p
roviding new program materials to all of our meeting attendees in replacement of materials from the ol
d
p
rogram. Second was the higher cost of in-meeting products relative to revenue as a result o
f
44