WeightWatchers 2010 Annual Report Download - page 59
Download and view the complete annual report
Please find page 59 of the 2010 WeightWatchers annual report below. You can navigate through the pages in the report by either clicking on the pages listed below, or by using the keyword search tool below to find specific information within the annual report.-
 1
1 -
2
-
3
-
4
-
5
-
6
-
7
-
8
-
9
-
10
-
11
-
12
-
13
-
14
-
15
-
16
-
17
-
18
-
19
-
20
-
21
-
22
-
23
-
24
-
25
-
26
-
27
-
28
-
29
-
30
-
31
-
32
-
33
-
34
-
35
-
36
-
37
-
38
-
39
-
40
-
41
-
42
-
43
-
44
-
45
-
46
-
47
-
48
-
 49
49 -
 50
50 -
 51
51 -
 52
52 -
 53
53 -
 54
54 -
 55
55 -
 56
56 -
 57
57 -
 58
58 -
 59
59 -
 60
60 -
 61
61 -
 62
62 -
 63
63 -
 64
64 -
 65
65 -
 66
66 -
 67
67 -
 68
68 -
 69
69 -
70
-
71
-
72
-
73
-
74
-
75
-
76
-
77
-
78
-
79
-
80
-
81
-
82
-
83
-
84
-
85
-
86
-
87
-
88
-
89
-
90
-
91
-
92
-
93
-
94
-
95
-
96
-
97
-
98
-
99
-
100
-
101
-
102
-
103
-
104
-
105
-
106
-
107
-
108
-
109
-
110
-
111
-
112
-
113
-
114
-
115
-
116
-
117
-
118
-
119
-
120
-
121
-
122
-
123
-
124
-
125
-
126
-
127
-
128
 |
 |
I
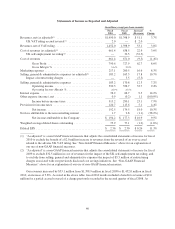
n NACO, meeting fees for fiscal 2010 were
$
545.3 million, a decrease of
$
1.7 million, or 0.3%, from
$
547.0 million for fiscal 2009. Full year 2010 NACO meeting paid weeks declined 1.0%, from 55.8 million in
f
iscal 2009 to
55
.3 million in fiscal 2010, and attendance declined
5
.7%, from 32.1 million in fiscal 2009 to
30.3 million in fiscal 201
0
,
a
s a result of performance weakness in the early part of the year. First quarter 201
0
meeting attendance was down 1
6
.0%, and paid weeks declined 8.0% versus the prior year period. This first
quarter performance weakness was the result of a marketing campaign in NACO that was ineffective at attracting
o
ur target consumer, coupled with the impact of very poor weather conditions, which caused some meeting
closures and low attendance in the remaining meetings in weather affected areas. In the spring, NACO launche
d
a new marketing strategy and campaign focused on member experience, featuring Jennifer Hudson as its new
spokesperson. With this change, business performance began an improvement trend in the second quarter 201
0
that continued through the rest of the year. Compared to prior year periods, second quarter 2010 attendance an
d
p
aid weeks declined 4.9% and 1.8%, respectively, while in the third quarter, attendance improved to a decline of
3.8% and paid weeks increased by 2.8%.
I
n addition to the benefits realized from the new marketing strategy, NACO initiated other growth strategies
during fiscal 2010, including revamping the retail structure in select markets, with a focus on a new look and feel
f
or the meeting centers, and consolidating meetings toward stronger locations and better performing leaders.
T
hese new strategies coupled with the launch of the ne
w
P
o
int
s
Plu
s
p
rogram in late November resulted in
a
p
ositive end to fiscal 2010 for NACO, with solid growth in the fourth quarter in both paid weeks and attendance,
up 4.2% and 6.8%, respectively, versus the fourth quarter of fiscal 2009.
F
or fiscal 2010, our international meeting fees were
$
274.4 million, an increase of
$
3.8 million, or 1.4%,
f
rom
$
270.6 million in the prior year period. After the
$
2.0 million adjustment to 2010 international meeting fees
f
or the UK VAT accrual reversal noted above, fiscal 2010 international meeting fees would have been
$
272.3
million, down
$
1.8 million, or 0.6%, versus prior year, or up
$
2.9 million or 1.1% on a constant currency basis
.
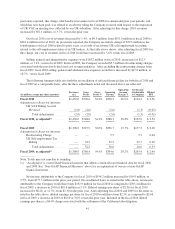
Paid weeks increased by 2.8% in the international meetings business, from 31.7 million in fiscal 2009 t
o
32.6 million in fiscal 2010. Attendance, however, declined by 6.6%, from 22.1 million in fiscal 2009 t
o
20.7 million in fiscal 2010
.
The lack of substantive growth in international meeting fees was primarily the result of weakness in th
e
U
nited Kingdom throughout the year and a slowdown in momentum in Continental Europe in the second half o
f
the year. Meeting fees in the United Kingdom declined by 1.3%, but excluding the benefit of the UK VA
T
accrual reversal would have declined by 2.0% on a constant currency basis, in fiscal 2010 versus fiscal 2009. Full
y
ear attendance performance in this market was weak, declining 10.
5
% versus the prior year. Paid weeks
,
however, were nearly on par with the prior year, down 0.4%, reflecting a continuation of growth in Monthly Pas
s
p
enetration and strong retention. In the first quarter 2010, UK attendance volumes were down 12.8%,
significantly impacted by weather and cycling against a program innovation in the prior year. Absent a new
marketing campaign in the spring to draw enrollments, the United Kingdom continued to experience deep
declines in attendance throughout 2010. In November 2010, the United Kingdom launched its new program
,
Pr
o
P
oi
nt
s
; however, because of a decision to significantly limit marketing in the fall campaign prior to the new
p
rogram launch, and as result of bad weather during this program launch period, fourth quarter 2010 attendances
were down 11.3% versus the fourth
q
uarter of 2009.
M
eeting fees in Continental Europe increased by 0.1%, or 3.4% on a constant currency basis, in fiscal 201
0
versus fiscal 2009. In the first half of 2010, the Continental European market experienced 3.3% meetin
g
attendance growth over the prior year period as a result of th
e
P
r
o
P
oi
nt
s
program
,
which drove an influx o
f
r
eturning members to our meetings who were attracted by the new program. The marketing of this new program
,
however, was not successful in capturing the attention of new members, and as a result, attendance began
a
decline in the third quarter which continued through the end of the year. In addition, France faced stron
g
competition from a new fad diet. For fiscal 2010, paid weeks in Continental Europe increased by 6.9%
,
benefiting from enrollment growth early in the year and an increase in Monthly Pass penetration, but attendances
declined by 1.6% versus prior year.
43