WeightWatchers 2010 Annual Report Download - page 47
Download and view the complete annual report
Please find page 47 of the 2010 WeightWatchers annual report below. You can navigate through the pages in the report by either clicking on the pages listed below, or by using the keyword search tool below to find specific information within the annual report.-
 1
1 -
2
-
3
-
4
-
5
-
6
-
7
-
8
-
9
-
10
-
11
-
12
-
13
-
14
-
15
-
16
-
17
-
18
-
19
-
20
-
21
-
22
-
23
-
24
-
25
-
26
-
27
-
28
-
29
-
30
-
31
-
32
-
33
-
34
-
35
-
36
-
 37
37 -
 38
38 -
 39
39 -
 40
40 -
 41
41 -
 42
42 -
 43
43 -
 44
44 -
 45
45 -
 46
46 -
 47
47 -
 48
48 -
 49
49 -
 50
50 -
 51
51 -
 52
52 -
 53
53 -
 54
54 -
 55
55 -
 56
56 -
 57
57 -
58
-
59
-
60
-
61
-
62
-
63
-
64
-
65
-
66
-
67
-
68
-
69
-
70
-
71
-
72
-
73
-
74
-
75
-
76
-
77
-
78
-
79
-
80
-
81
-
82
-
83
-
84
-
85
-
86
-
87
-
88
-
89
-
90
-
91
-
92
-
93
-
94
-
95
-
96
-
97
-
98
-
99
-
100
-
101
-
102
-
103
-
104
-
105
-
106
-
107
-
108
-
109
-
110
-
111
-
112
-
113
-
114
-
115
-
116
-
117
-
118
-
119
-
120
-
121
-
122
-
123
-
124
-
125
-
126
-
127
-
128
 |
 |

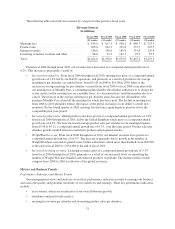
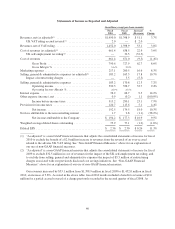
The following table sets forth our revenues by category for the past five fiscal years.
Revenue
S
ource
s
(in millions)
Fi
sca
l 2010
F
i
sca
l 200
9
Fi
sca
l 2008 Fi
sca
l 200
7
F
i
sca
l 200
6
(
52 weeks
)(
52 weeks
)(
53 weeks
)(
52 weeks
)(
52 weeks
)
Meetings fee
s
.
...............................
$
8
19.6
$
817.5
$
908.1
$
880.7
$
723.
1
Pr
oduct sa
l
es
................................
3
0
5
.0 2
9
2.1 33
9
.8 337.7 2
9
3.3
Internet revenue
s
.............................
238.8 1
9
6.0 18
5
.8 1
5
1.6 12
9
.
4
Licensing, franchise royalties and other
...........
8
8.6
9
3.3 102.1
9
7.2 87.
5
T
ota
l
.......................................
$1
,
452.0 $1
,
398.9 $1
,
535.8 $1
,
467.2 $1
,
233.3
F
rom fiscal 200
6
through fiscal 2010, our revenues have increased at a compound annual growth rate o
f
4.2%. This increase is principally a result of
:
•
I
ncreased meeting fees
.
From fiscal 200
6
through fiscal 2010, meeting fees grew at a compound annua
l
g
rowth rate of 3.2% led by our NACO operations, and primarily as a result of growth in our average
m
eeting fee per attendee, on a global basis, from
$
11.83 in 2006 to
$
16.08 in 2010. Most of the
i
ncrease in average meeting fee per attendee occurred from fiscal 200
6
to fiscal 2008 coincident with
o
ur introduction of Monthly Pass, a commitment plan whereby the member authorizes us to charge his
o
r her credit card for meeting fees on a monthly basis, at a discounted rate, until the member elects to
c
ancel. The increase in the average meeting fee per attendee arises because not all members wh
o
p
urchase Monthly Pass attend all the meetings for which they have paid. The decline in meeting fee
s
f
rom 2008 to 2010 primarily reflects the impact of the global recession on our ability to enroll ne
w
m
embers. By the fourth quarter of 2010, meeting fees had once again begun to increase above the
c
omparable prior year period.
•
I
ncreased
p
roduct sale
s
.
Global product sales have grown at a compound annual growth rate of 1.0%
f
rom fiscal 200
6
through fiscal 2010, led by the United Kingdom which grew at a compound annual
g
rowth rate of 4.0%. We have increased average product sales per attendee in our meetings busines
s
f
rom
$
3.94 to
$
5.11, a compound annual growth rate of 6.7%, over the same period. Product sales pe
r
a
ttendee growth resulted from successful new product and program launches.
•
W
eightWatchers.co
m
. From fiscal 2006 through fiscal 2010, our Internet revenues have grown at
a
c
ompound annual growth rate of 16.
5
%. The increase is primarily due to growth in the number o
f
W
eightWatchers.com end-of-period active Online subscribers which more than doubled, from 460,00
0
a
t the end of fiscal 2006 to 1,0
5
4,000 at the end of fiscal 2010.
•
I
ncreased licensing revenues
.
L
icensing revenues grew at a compound annual growth rate of
5
.3%
f
rom fiscal 2006 through fiscal 2010, primarily as a result of our increased focus on expanding the
n
umber of Weight Watchers branded and endorsed products worldwide. The decline in this revenu
e
c
ategory from 2008 to 2010 is reflective of the global recession.
Me
tri
cs a
n
d
B
us
in
ess
Tr
e
n
ds
P
er
f
ormance In
d
icators an
d
Mar
k
et Tren
ds
O
ur management rev
i
ews an
d
ana
l
yzes severa
lk
ey per
f
ormance
i
n
di
cators
i
nor
d
er to manage our
b
us
i
ness
an
d
assess t
h
e qua
li
ty an
d
potent
i
a
l
var
i
a
bili
ty o
f
our cas
hfl
ows an
d
earn
i
ngs. T
h
ese
k
ey per
f
ormance
i
n
di
cators
i
nc
l
u
d
e
:
•
net revenues, w
hi
c
h
are an
i
n
di
cator o
f
our overa
ll b
us
i
ness
g
rowt
h
;
•
atten
d
ance an
d
pa
id
wee
k
s metr
i
cs;
•
meet
i
n
gf
ee revenue per atten
d
ee an
di
n-meet
i
n
g
pro
d
uct sa
l
es per atten
d
ee;
31