WeightWatchers 2010 Annual Report Download - page 49
Download and view the complete annual report
Please find page 49 of the 2010 WeightWatchers annual report below. You can navigate through the pages in the report by either clicking on the pages listed below, or by using the keyword search tool below to find specific information within the annual report.-
 1
1 -
2
-
3
-
4
-
5
-
6
-
7
-
8
-
9
-
10
-
11
-
12
-
13
-
14
-
15
-
16
-
17
-
18
-
19
-
20
-
21
-
22
-
23
-
24
-
25
-
26
-
27
-
28
-
29
-
30
-
31
-
32
-
33
-
34
-
35
-
36
-
37
-
38
-
 39
39 -
 40
40 -
 41
41 -
 42
42 -
 43
43 -
 44
44 -
 45
45 -
 46
46 -
 47
47 -
 48
48 -
 49
49 -
 50
50 -
 51
51 -
 52
52 -
 53
53 -
 54
54 -
 55
55 -
 56
56 -
 57
57 -
 58
58 -
 59
59 -
60
-
61
-
62
-
63
-
64
-
65
-
66
-
67
-
68
-
69
-
70
-
71
-
72
-
73
-
74
-
75
-
76
-
77
-
78
-
79
-
80
-
81
-
82
-
83
-
84
-
85
-
86
-
87
-
88
-
89
-
90
-
91
-
92
-
93
-
94
-
95
-
96
-
97
-
98
-
99
-
100
-
101
-
102
-
103
-
104
-
105
-
106
-
107
-
108
-
109
-
110
-
111
-
112
-
113
-
114
-
115
-
116
-
117
-
118
-
119
-
120
-
121
-
122
-
123
-
124
-
125
-
126
-
127
-
128
 |
 |
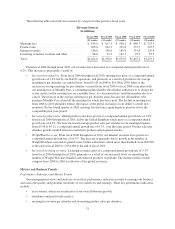
attendance essentially approximated growth in meeting paid weeks. However, as of fiscal 2010, approximately
76
% of meeting paid weeks was attributable to commitment plans and therefore attendance and paid weeks are
no longer directly correlated. For Weight Watchers Online, paid weeks is the total paid Weight Watchers Onlin
e
subscriber weeks for a given period.
A
s shown in the table above, our worldwide meetin
g
paid weeks
g
rew from
6
8.8 million in fiscal 200
6
to
8
7.9 million in fiscal 2010, an increase of 27.8%, or
6
.3% on a compound annual
g
rowth rate basis. The
difference between meetin
g
paid weeks and attendance widened
y
ear-over-
y
ear primaril
y
due to
g
rowth in ne
w
Monthl
y
Pass subscribers as Monthl
y
Pass penetration expanded
g
loball
y
. In NACO, where Monthl
y
Pass i
s
hi
g
hl
y
penetrated, fiscal 2010 meetin
g
paid weeks of 55.3 million exceeded meetin
g
attendance of 30.3 million
b
y
82.3%. Wei
g
ht Watchers Online paid weeks
g
rew at a compound annual rate of 20.1% from 200
6
to 2010
,
increasin
g
from 25.2 million to 52.5 million.
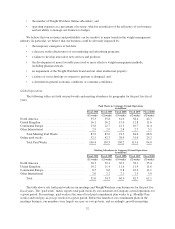
A
ss
h
own
i
nt
h
eta
bl
ea
b
ove, our wor
ld
w
id
e annua
l
meet
i
ng atten
d
ance
i
n our Company-owne
d
operat
i
ons
has declined from 61.1 million for fiscal 2006 to
5
1.0 million for fiscal 2010, a decline of 4.4% on a compound
annua
l
growt
h
rate
b
as
i
s. Our wor
ld
w
id
e average meet
i
ng revenue per atten
d
ee,
h
owever,
h
as
i
ncrease
d
over t
h
e
same per
i
o
d
,
l
arge
l
y as a resu
l
to
f
Mont
hl
y Pass’ grow
i
ng penetrat
i
on
i
n NACO an
d
ot
h
er mar
k
ets, an
d
growt
hi
n
p
ro
d
uct sa
l
es per atten
d
ee.
Nort
h
America Meeting Metrics an
d
Business Tren
d
s
N
ACO meetin
g
paid weeks
g
rew si
g
nificantl
y
from 200
6
to 2008, b
y
42.9%, as a result of the 200
6
introduction and rapid penetration of Monthl
y
Pass into the North American meetin
g
s business. Attendance over
the same period
g
rew moderatel
y
, primaril
y
as a result of franchise acquisitions, up from 35.4 million in 2006 to
36
.
5
million in 2
008
.
I
n 2008 an
d
2009, t
h
e wea
k
econom
yi
nt
h
eUn
i
te
d
States
h
a
d
as
ig
n
ifi
cant
i
mpact on our meet
i
n
gs
business. In 2008, we were able to maintain
g
rowth in paid weeks, which increased 4.5% over the prior
y
ear,
l
ar
g
e
ly
as a resu
l
to
fi
ncrease
d
Mont
hly
Pass penetrat
i
on,
b
ut
i
n 2009, pa
id
wee
k
s
d
ec
li
ne
dby
8.4% versus t
he
2008 level. Meetin
g
attendance, however, declined for the full
y
ear 2008 b
y
4.3% (6.2% excludin
g
the impact o
f
f
ranc
hi
se acqu
i
s
i
t
i
ons), an
dd
ec
li
ne
dby
a
f
urt
h
er 11.8%
i
nt
h
e
f
u
ll y
ear 2009. T
h
e econom
i
c recess
i
on, coup
l
e
d
w
i
t
h
re
d
uce
d
cre
di
t ava
il
a
bili
t
y
,a
d
verse
ly i
mpacte
d
consumer spen
di
n
g
. We saw t
h
e
i
mpact most acute
ly i
n
enro
ll
ments, part
i
cu
l
ar
ly
o
f
new mem
b
ers w
h
o
h
a
d
never
b
een to We
igh
t Watc
h
ers. In a
ddi
t
i
on to t
h
e econom
ic
f
actors a
ff
ect
i
n
g
t
h
ese two
y
ears, t
h
e
l
ac
k
o
f
a mean
i
n
gf
u
l
pro
g
ram
i
nnovat
i
on
i
n NACO
f
or severa
ly
ear
s
contr
ib
ute
d
to t
h
e
d
ec
li
ne
i
nt
h
e NACO meet
i
n
g
s
b
us
i
ness
.
F
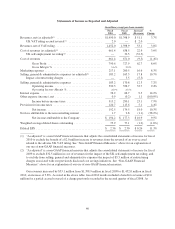
or the full year fiscal 2010, NACO meeting paid weeks declined 1.0% and attendance declined
5
.7%, as
a
r
esult of performance weakness in the early part of the year. First quarter meeting paid weeks declined 8.0% an
d
attendance was down 16.0%, com
p
ared to first
q
uarter 2009. The
p
erformance weakness was the result of a
marketing campaign that was ineffective at recruiting customers, coupled with the impact of very poor weathe
r
conditions in the quarter, which resulted in some meeting closures and low attendance in the remaining meeting
s
in weather-affected areas. In the spring, NACO launched a new marketing strategy and campaign focused o
n
member experience, featuring Jennifer Hudson as its new spokesperson. With this change, business performanc
e
began an improvement trend in the second quarter that continued through the rest of the year. Compared to prio
r
y
ear periods, second quarter 2010 paid weeks and attendance declined 1.8% and 4.9%, respectively, while in th
e
third quarter, paid weeks increased by 2.8% and attendance improved to a decline of 3.8%
.
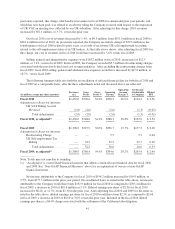
I
n addition to the benefits realized from the new marketin
g
strate
gy
, NACO initiated other
g
rowth strate
g
ies
durin
g
fiscal 2010, includin
g
revampin
g
the retail structure in select markets, with a focus on a new look and feel
f
or the meetin
g
centers, and consolidatin
g
meetin
g
s toward stron
g
er locations and better performin
g
leaders.
T
hese new strate
g
ies coupled with the launch of the ne
w
P
o
int
s
P
l
u
s
p
ro
g
ram in late November resulted in
a
33