Virgin Media 2009 Annual Report Download - page 78
Download and view the complete annual report
Please find page 78 of the 2009 Virgin Media annual report below. You can navigate through the pages in the report by either clicking on the pages listed below, or by using the keyword search tool below to find specific information within the annual report.-
 1
1 -
2
-
3
-
4
-
5
-
6
-
7
-
8
-
9
-
10
-
11
-
12
-
13
-
14
-
15
-
16
-
17
-
18
-
19
-
20
-
21
-
22
-
23
-
24
-
25
-
26
-
27
-
28
-
29
-
30
-
31
-
32
-
33
-
34
-
35
-
36
-
37
-
38
-
39
-
40
-
41
-
42
-
43
-
44
-
45
-
46
-
47
-
48
-
49
-
50
-
51
-
52
-
53
-
54
-
55
-
56
-
57
-
58
-
59
-
60
-
61
-
62
-
63
-
64
-
65
-
66
-
67
-
 68
68 -
 69
69 -
 70
70 -
 71
71 -
 72
72 -
 73
73 -
 74
74 -
 75
75 -
 76
76 -
 77
77 -
 78
78 -
 79
79 -
 80
80 -
 81
81 -
 82
82 -
 83
83 -
 84
84 -
 85
85 -
 86
86 -
 87
87 -
 88
88 -
89
-
90
-
91
-
92
-
93
-
94
-
95
-
96
-
97
-
98
-
99
-
100
-
101
-
102
-
103
-
104
-
105
-
106
-
107
-
108
-
109
-
110
-
111
-
112
-
113
-
114
-
115
-
116
-
117
-
118
-
119
-
120
-
121
-
122
-
123
-
124
-
125
-
126
-
127
-
128
-
129
-
130
-
131
-
132
-
133
-
134
-
135
-
136
-
137
-
138
-
139
-
140
-
141
-
142
-
143
-
144
-
145
-
146
-
147
-
148
-
149
-
150
-
151
-
152
-
153
-
154
-
155
-
156
-
157
-
158
-
159
-
160
-
161
-
162
-
163
-
164
-
165
-
166
-
167
-
168
-
169
-
170
-
171
-
172
-
173
-
174
-
175
-
176
-
177
-
178
-
179
-
180
-
181
-
182
-
183
-
184
-
185
-
186
-
187
-
188
-
189
-
190
-
191
-
192
-
193
-
194
-
195
-
196
-
197
-
198
-
199
-
200
-
201
-
202
-
203
-
204
-
205
-
206
-
207
-
208
-
209
-
210
-
211
-
212
-
213
-
214
-
215
-
216
-
217
-
218
-
219
-
220
-
221
-
222
-
223
-
224
-
225
-
226
-
227
-
228
-
229
-
230
-
231
-
232
 |
 |
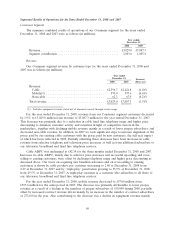
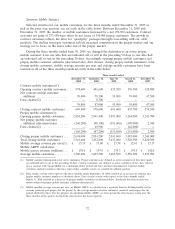
Consolidated Statement of Cash Flows
Years Ended December 31, 2009 and 2008
For the year ended December 31, 2009, cash provided by operating activities increased to
£900.6 million from £758.7 million for the year ended December 31, 2008. This increase was
attributable to the improvements in operating results and lower cash interest payments. For the year
ended December 31, 2009, cash paid for interest, exclusive of amounts capitalized, decreased to
£404.2 million from £515.8 million during the same period in 2008. This decrease resulted from lower
interest rates, lower debt levels due to repayments in 2008 and differences in the timing of interest
payments under our senior credit facility.
For the year ended December 31, 2009, cash used in investing activities increased to £572.3 million
from £468.7 million for the year ended December 31, 2008. The cash used in investing activities in the
years ended December 31, 2009 and 2008 mainly represented purchases of fixed assets. Purchases of
fixed and intangible assets increased to £569.0 million for the year ended December 31, 2009 from
£477.9 million for the same period in 2008, primarily due to lower use of finance leases for the
acquisition of capital equipment together with increased scaleable infrastructure costs relating to
broadband speed upgrades.
Cash used in financing activities for the year ended December 31, 2009 was £69.7 million
compared with cash used in financing activities of £427.3 million for the year ended December 31,
2008. For the year ended December 31, 2009, the principal uses of cash were the partial repayments
under our senior credit facility and our senior notes due 2014, and capital lease payments, totaling
£1,737.4 million, and the principal components of cash provided by financing activities were new
borrowings from the issuance of our senior notes due 2016 and our senior notes due 2019, net of
financing fees, of £1,610.2 million. For the year ended December 31, 2008, the principal uses of cash
were the partial repayments under our senior credit facility and capital lease payments, totaling
£846.3 million, and the principal components of cash provided by financing activities were new
borrowings from the issuance of our convertible senior notes, net of financing fees, of £447.7 million.
See further discussion under Liquidity and Capital Resources—Senior Credit Facility.
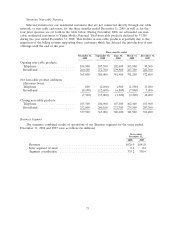
Years Ended December 31, 2008 and 2007
For the year ended December 31, 2008, cash provided by operating activities increased to
£758.7 million from £710.8 million for the year ended December 31, 2007. This increase was primarily
attributable to an improvement in working capital, partially offset by an increase in cash paid for
interest. For the year ended December 31, 2008, cash paid for interest, exclusive of amounts
capitalized, increased to £515.8 million from £486.9 million during the same period in 2007. This
increase resulted from changes in the timing of interest payments under our senior credit facility.
For the year ended December 31, 2008, cash used in investing activities was £468.7 million
compared with cash used in investing activities of £507.3 million for the year ended December 31, 2007.
The cash used in investing activities in the years ended December 31, 2008 and 2007 mainly
represented purchases of fixed assets. Purchases of fixed and intangible assets decreased to
£477.9 million for the year ended December 31, 2008 from £533.7 million for the same period in 2007,
reflecting a higher utilization of finance leases.
Cash used in financing activities for the year ended December 31, 2008 was £427.3 million
compared with cash used in financing activities of £302.5 million for the year ended December 31,
2007. For the year ended December 31, 2008, the principal uses of cash were the partial repayments
under our senior credit facility and capital lease payments, totaling £846.3 million, and the principal
components of cash provided by financing activities were new borrowings from the issuance of our
convertible senior notes, net of financing fees, of £447.7 million. For the year ended December 31,
76