Virgin Media 2009 Annual Report Download - page 71
Download and view the complete annual report
Please find page 71 of the 2009 Virgin Media annual report below. You can navigate through the pages in the report by either clicking on the pages listed below, or by using the keyword search tool below to find specific information within the annual report.-
 1
1 -
2
-
3
-
4
-
5
-
6
-
7
-
8
-
9
-
10
-
11
-
12
-
13
-
14
-
15
-
16
-
17
-
18
-
19
-
20
-
21
-
22
-
23
-
24
-
25
-
26
-
27
-
28
-
29
-
30
-
31
-
32
-
33
-
34
-
35
-
36
-
37
-
38
-
39
-
40
-
41
-
42
-
43
-
44
-
45
-
46
-
47
-
48
-
49
-
50
-
51
-
52
-
53
-
54
-
55
-
56
-
57
-
58
-
59
-
60
-
 61
61 -
 62
62 -
 63
63 -
 64
64 -
 65
65 -
 66
66 -
 67
67 -
 68
68 -
 69
69 -
 70
70 -
 71
71 -
 72
72 -
 73
73 -
 74
74 -
 75
75 -
 76
76 -
 77
77 -
 78
78 -
 79
79 -
 80
80 -
 81
81 -
82
-
83
-
84
-
85
-
86
-
87
-
88
-
89
-
90
-
91
-
92
-
93
-
94
-
95
-
96
-
97
-
98
-
99
-
100
-
101
-
102
-
103
-
104
-
105
-
106
-
107
-
108
-
109
-
110
-
111
-
112
-
113
-
114
-
115
-
116
-
117
-
118
-
119
-
120
-
121
-
122
-
123
-
124
-
125
-
126
-
127
-
128
-
129
-
130
-
131
-
132
-
133
-
134
-
135
-
136
-
137
-
138
-
139
-
140
-
141
-
142
-
143
-
144
-
145
-
146
-
147
-
148
-
149
-
150
-
151
-
152
-
153
-
154
-
155
-
156
-
157
-
158
-
159
-
160
-
161
-
162
-
163
-
164
-
165
-
166
-
167
-
168
-
169
-
170
-
171
-
172
-
173
-
174
-
175
-
176
-
177
-
178
-
179
-
180
-
181
-
182
-
183
-
184
-
185
-
186
-
187
-
188
-
189
-
190
-
191
-
192
-
193
-
194
-
195
-
196
-
197
-
198
-
199
-
200
-
201
-
202
-
203
-
204
-
205
-
206
-
207
-
208
-
209
-
210
-
211
-
212
-
213
-
214
-
215
-
216
-
217
-
218
-
219
-
220
-
221
-
222
-
223
-
224
-
225
-
226
-
227
-
228
-
229
-
230
-
231
-
232
 |
 |

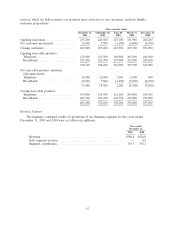
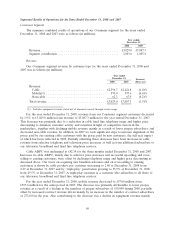
Segmental Results of Operations for the Years Ended December 31, 2008 and 2007
Consumer Segment
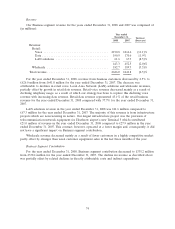
The summary combined results of operations of our Consumer segment for the years ended
December 31, 2008 and 2007 were as follows (in millions):
Year ended
December 31,
2008 2007
Revenue ............................................ £3,029.0 £3,087.3
Segment contribution ................................... 1,803.6 1,805.4
Revenue
Our Consumer segment revenue by customer type for the years ended December 31, 2008 and
2007 was as follows (in millions):
Year ended
December 31, Increase/
2008 2007 (Decrease)
Revenue:
Cable .................................... £2,396.7 £2,421.8 (1.0)%
Mobile(1) ................................. 570.0 597.6 (4.6)%
Non-cable ................................. 62.3 67.9 (8.2)%
Total revenue ................................ £3,029.0 £3,087.3 (1.9)%
(1) Includes equipment revenue stated net of discounts earned through service usage.
For the year ended December 31, 2008, revenue from our Consumer segment customers decreased
by 1.9% to £3,029.0 million from revenue of £3,087.3 million for the year ended December 31, 2007.
This decrease was primarily due to a reduction in cable fixed line telephony usage and higher price
discounting to stimulate customer activity and retention in light of competitive factors in the
marketplace, together with declining mobile revenue mainly as a result of lower prepay subscribers, and
decreased non-cable revenue. In addition, in 2007 we took significant steps to increase alignment of the
prices paid by our existing cable customers with the prices paid by new customers, the full year impact
of which has been reflected in 2008. Partially offsetting these decreases have been increases in cable
revenue from selective telephony and television price increases as well as from additional subscribers to
our television, broadband and fixed line telephone services.
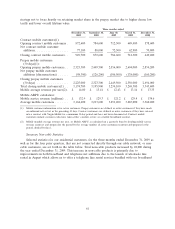
Cable ARPU was unchanged at £42.34 for the three months ended December 31, 2008 and 2007.
Increases in cable ARPU, mainly due to selective price increases and successful up-selling and cross-
selling to existing customers, were offset by declining telephony usage and higher price discounting as
discussed above. Our focus on acquiring new bundled customers and on cross-selling to existing
customers is shown by cable products per customer increasing to 2.40 at December 31, 2008 from
2.29 at December 31, 2007 and by ‘‘triple-play’’ penetration growing to 55.9% at December 31, 2008
from 49.5% at December 31, 2007. A triple-play customer is a customer who subscribes to all three of
our television, broadband and fixed line telephone services.
For the year ended December 31, 2008, mobile revenue decreased to £570.0 million from
£597.6 million for the same period in 2007. The decrease was primarily attributable to lower prepay
revenue as a result of a decline in the numbers of prepay subscribers of 550,000 during 2008, partially
offset by increased contract revenue driven mainly by an increase in the number of contract subscribers
of 273,100 in the year. Also contributing to the decrease was a decline in equipment revenue mainly
69