Virgin Media 2009 Annual Report Download - page 180
Download and view the complete annual report
Please find page 180 of the 2009 Virgin Media annual report below. You can navigate through the pages in the report by either clicking on the pages listed below, or by using the keyword search tool below to find specific information within the annual report.-
 1
1 -
2
-
3
-
4
-
5
-
6
-
7
-
8
-
9
-
10
-
11
-
12
-
13
-
14
-
15
-
16
-
17
-
18
-
19
-
20
-
21
-
22
-
23
-
24
-
25
-
26
-
27
-
28
-
29
-
30
-
31
-
32
-
33
-
34
-
35
-
36
-
37
-
38
-
39
-
40
-
41
-
42
-
43
-
44
-
45
-
46
-
47
-
48
-
49
-
50
-
51
-
52
-
53
-
54
-
55
-
56
-
57
-
58
-
59
-
60
-
61
-
62
-
63
-
64
-
65
-
66
-
67
-
68
-
69
-
70
-
71
-
72
-
73
-
74
-
75
-
76
-
77
-
78
-
79
-
80
-
81
-
82
-
83
-
84
-
85
-
86
-
87
-
88
-
89
-
90
-
91
-
92
-
93
-
94
-
95
-
96
-
97
-
98
-
99
-
100
-
101
-
102
-
103
-
104
-
105
-
106
-
107
-
108
-
109
-
110
-
111
-
112
-
113
-
114
-
115
-
116
-
117
-
118
-
119
-
120
-
121
-
122
-
123
-
124
-
125
-
126
-
127
-
128
-
129
-
130
-
131
-
132
-
133
-
134
-
135
-
136
-
137
-
138
-
139
-
140
-
141
-
142
-
143
-
144
-
145
-
146
-
147
-
148
-
149
-
150
-
151
-
152
-
153
-
154
-
155
-
156
-
157
-
158
-
159
-
160
-
161
-
162
-
163
-
164
-
165
-
166
-
167
-
168
-
169
-
 170
170 -
 171
171 -
 172
172 -
 173
173 -
 174
174 -
 175
175 -
 176
176 -
 177
177 -
 178
178 -
 179
179 -
 180
180 -
 181
181 -
 182
182 -
 183
183 -
 184
184 -
 185
185 -
 186
186 -
 187
187 -
 188
188 -
 189
189 -
 190
190 -
191
-
192
-
193
-
194
-
195
-
196
-
197
-
198
-
199
-
200
-
201
-
202
-
203
-
204
-
205
-
206
-
207
-
208
-
209
-
210
-
211
-
212
-
213
-
214
-
215
-
216
-
217
-
218
-
219
-
220
-
221
-
222
-
223
-
224
-
225
-
226
-
227
-
228
-
229
-
230
-
231
-
232
 |
 |

VIRGIN MEDIA INVESTMENT HOLDINGS LIMITED AND SUBSIDIARIES
NOTES TO CONSOLIDATED FINANCIAL STATEMENTS (Continued)
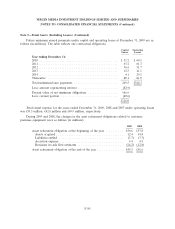
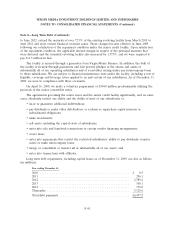
Note 4—Disposals (Continued)
The fair value of the sit-up reporting unit, which was determined through the use of a combination
of both the market and income approaches to calculate fair value, was found to be less than the
carrying value. The market and income approaches declined from the goodwill impairment test we
performed as at June 30, 2008 as a result of reduced long term cash flow estimates. As a result, we
extended our review to include the valuation of the reporting unit’s individual assets and liabilities and
recognized a goodwill impairment charge of £39.9 million. During the year ended December 31, 2008,
we impaired intangible assets relating to our sit-up reporting unit totaling £14.9 million. Subsequent to
the year end, in accordance with the provisions of the Property, Plant, and Equipment Topic of the
FASB ASC, we wrote down the assets held for sale to fair value based upon the agreed purchase
consideration. This resulted in a £19.0 million impairment charge, which was recognized in the loss
from discontinued operations for the year ended December 31, 2009.
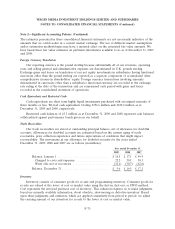
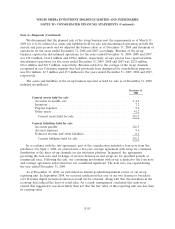
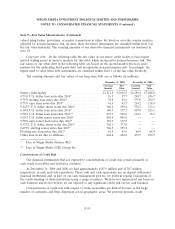
Note 5—Fixed Assets (Including Leases)
Fixed assets consist of (in millions):
December 31,
2009 2008
Under Under
Useful Economic Capital Capital
Life Total Leases Total Leases
Operating equipment
Cable distribution plant ............ 8-30 years £ 6,187.9 £ 28.8 £ 5,923.9 £ 28.8
Switches and headends ............. 8-10 years 806.9 20.0 740.9 29.4
Customer premises equipment ....... 5-10 years 1,146.7 — 1,062.5 —
Other operating equipment ......... 8-20 years 11.6 — 7.3 —
Total operating equipment .......... 8,153.1 48.8 7,734.6 58.2
Other equipment
Land.......................... — 13.2 — 13.2 —
Buildings ....................... 30 years 113.8 — 114.8 —
Leasehold improvements ........... 7 years or, if less, 60.4 — 53.4 —
the lease term
Computer infrastructure ............ 3-5 years 276.3 56.3 233.1 63.5
Other equipment ................. 5-12 years 254.9 124.0 273.0 108.0
Total other equipment ............. 718.6 180.3 687.5 171.5
8,871.7 229.1 8,422.1 229.7
Accumulated depreciation ............ (4,084.5) (88.0) (3,316.0) (70.6)
4,787.2 141.1 5,106.1 159.1
Construction in progress ............. 138.1 — 103.2 —
£ 4,925.3 £141.1 £ 5,209.3 £159.1
During the years ended December 31, 2009, 2008 and 2007, the assets acquired under capital
leases totaled £34.4 million, £99.2 million and £45.8 million, respectively.
F-84