Virgin Media 2009 Annual Report Download - page 62
Download and view the complete annual report
Please find page 62 of the 2009 Virgin Media annual report below. You can navigate through the pages in the report by either clicking on the pages listed below, or by using the keyword search tool below to find specific information within the annual report.-
 1
1 -
2
-
3
-
4
-
5
-
6
-
7
-
8
-
9
-
10
-
11
-
12
-
13
-
14
-
15
-
16
-
17
-
18
-
19
-
20
-
21
-
22
-
23
-
24
-
25
-
26
-
27
-
28
-
29
-
30
-
31
-
32
-
33
-
34
-
35
-
36
-
37
-
38
-
39
-
40
-
41
-
42
-
43
-
44
-
45
-
46
-
47
-
48
-
49
-
50
-
51
-
 52
52 -
 53
53 -
 54
54 -
 55
55 -
 56
56 -
 57
57 -
 58
58 -
 59
59 -
 60
60 -
 61
61 -
 62
62 -
 63
63 -
 64
64 -
 65
65 -
 66
66 -
 67
67 -
 68
68 -
 69
69 -
 70
70 -
 71
71 -
 72
72 -
73
-
74
-
75
-
76
-
77
-
78
-
79
-
80
-
81
-
82
-
83
-
84
-
85
-
86
-
87
-
88
-
89
-
90
-
91
-
92
-
93
-
94
-
95
-
96
-
97
-
98
-
99
-
100
-
101
-
102
-
103
-
104
-
105
-
106
-
107
-
108
-
109
-
110
-
111
-
112
-
113
-
114
-
115
-
116
-
117
-
118
-
119
-
120
-
121
-
122
-
123
-
124
-
125
-
126
-
127
-
128
-
129
-
130
-
131
-
132
-
133
-
134
-
135
-
136
-
137
-
138
-
139
-
140
-
141
-
142
-
143
-
144
-
145
-
146
-
147
-
148
-
149
-
150
-
151
-
152
-
153
-
154
-
155
-
156
-
157
-
158
-
159
-
160
-
161
-
162
-
163
-
164
-
165
-
166
-
167
-
168
-
169
-
170
-
171
-
172
-
173
-
174
-
175
-
176
-
177
-
178
-
179
-
180
-
181
-
182
-
183
-
184
-
185
-
186
-
187
-
188
-
189
-
190
-
191
-
192
-
193
-
194
-
195
-
196
-
197
-
198
-
199
-
200
-
201
-
202
-
203
-
204
-
205
-
206
-
207
-
208
-
209
-
210
-
211
-
212
-
213
-
214
-
215
-
216
-
217
-
218
-
219
-
220
-
221
-
222
-
223
-
224
-
225
-
226
-
227
-
228
-
229
-
230
-
231
-
232
 |
 |

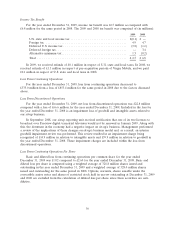
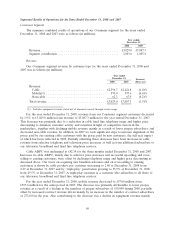
number of cable products grew to 11,727,600 at December 31, 2009 from 11,403,000 at December 31,
2008, representing a net increase in products of 324,600.
Three months ended
December 31, September 30, June 30, March 31, December 31,
2009 2009 2009 2009 2008
Opening customers .......... 4,744,200 4,736,100 4,762,300 4,755,200 4,740,400
Customer additions .......... 198,600 213,800 159,500 167,200 192,600
Customer disconnects ........ (170,000) (205,700) (185,700) (160,100) (177,800)
Net customer movement ...... 28,600 8,100 (26,200) 7,100 14,800
Closing customers ........... 4,772,800 4,744,200 4,736,100 4,762,300 4,755,200
Cable churn(1) ............. 1.2% 1.5% 1.3% 1.1% 1.2%
Cable products(2):
Television ............... 3,743,200 3,709,000 3,672,000 3,651,600 3,621,000
DTV (included in
Television) ........... 3,656,200 3,599,300 3,543,300 3,510,400 3,469,000
ATV (included in
Television) ........... 87,000 109,700 128,700 141,200 152,000
Telephone ............... 4,146,600 4,120,000 4,104,000 4,108,300 4,099,200
Broadband ............... 3,837,800 3,774,200 3,735,200 3,730,100 3,682,800
Total cable products ......... 11,727,600 11,603,200 11,511,200 11,490,000 11,403,000
Cable products/Customer ...... 2.46x 2.45x 2.43x 2.41x 2.40x
Triple-play penetration ........ 60.5% 59.5% 58.3% 57.0% 55.9%
Cable Average Revenue Per
User(3)(4) ............... £ 44.81 £ 44.24 £ 43.27 £ 42.29 £ 42.34
Cable ARPU calculation:
Cable revenue (millions)(4) .... £ 640.1 £ 627.6 £ 616.8 £ 604.0 £ 603.5
Average customers .......... 4,761,900 4,728,300 4,751,600 4,761,000 4,751,000
(1) Customer churn is calculated by taking the total disconnects during the month (excluding any data cleanse activity) and
dividing them by the average number of customers during the month. Average monthly churn during a quarter is the
average of the three monthly churn calculations within the quarter.
(2) Each telephone, television and broadband internet subscriber directly connected to our network counts as one product.
Accordingly, a subscriber who receives both telephone and television service counts as two products. Products may include
subscribers receiving some services for free or at a reduced rate in connection with promotional offers.
(3) The monthly cable average revenue per user, or cable ARPU, is calculated on a quarterly basis by dividing total revenue
generated from the provision of telephone, television and internet services to customers who are directly connected to our
network in that period together with revenue generated from our customers using our virginmedia.com website, exclusive of
VAT, by the average number of customers directly connected to our network in that period divided by three.
(4) As a result of the treatment of sit-up as discontinued operations and the retroactive adjustment of prior periods, cable
revenue and cable ARPU have increased as we previously eliminated revenue earned from sit-up on consolidation.
Summary Mobile Statistics
Selected statistics for our mobile customers, for the three months ended December 31, 2009 as
well as for the four prior quarters, are set forth in the table below. Between December 31, 2009 and
December 31, 2008, the number of mobile customers decreased by a net 168,700 customers. Contract
customer net gains of 300,300 were offset by net losses of 469,000 prepay customers. The growth in
contract customers reflects the drive for ‘‘quad-play’’ packages through cross-selling with our cable
products. The decline in prepay customers reflects increased competition in the prepay market and our
60