Virgin Media 2009 Annual Report Download - page 68
Download and view the complete annual report
Please find page 68 of the 2009 Virgin Media annual report below. You can navigate through the pages in the report by either clicking on the pages listed below, or by using the keyword search tool below to find specific information within the annual report.-
 1
1 -
2
-
3
-
4
-
5
-
6
-
7
-
8
-
9
-
10
-
11
-
12
-
13
-
14
-
15
-
16
-
17
-
18
-
19
-
20
-
21
-
22
-
23
-
24
-
25
-
26
-
27
-
28
-
29
-
30
-
31
-
32
-
33
-
34
-
35
-
36
-
37
-
38
-
39
-
40
-
41
-
42
-
43
-
44
-
45
-
46
-
47
-
48
-
49
-
50
-
51
-
52
-
53
-
54
-
55
-
56
-
57
-
 58
58 -
 59
59 -
 60
60 -
 61
61 -
 62
62 -
 63
63 -
 64
64 -
 65
65 -
 66
66 -
 67
67 -
 68
68 -
 69
69 -
 70
70 -
 71
71 -
 72
72 -
 73
73 -
 74
74 -
 75
75 -
 76
76 -
 77
77 -
 78
78 -
79
-
80
-
81
-
82
-
83
-
84
-
85
-
86
-
87
-
88
-
89
-
90
-
91
-
92
-
93
-
94
-
95
-
96
-
97
-
98
-
99
-
100
-
101
-
102
-
103
-
104
-
105
-
106
-
107
-
108
-
109
-
110
-
111
-
112
-
113
-
114
-
115
-
116
-
117
-
118
-
119
-
120
-
121
-
122
-
123
-
124
-
125
-
126
-
127
-
128
-
129
-
130
-
131
-
132
-
133
-
134
-
135
-
136
-
137
-
138
-
139
-
140
-
141
-
142
-
143
-
144
-
145
-
146
-
147
-
148
-
149
-
150
-
151
-
152
-
153
-
154
-
155
-
156
-
157
-
158
-
159
-
160
-
161
-
162
-
163
-
164
-
165
-
166
-
167
-
168
-
169
-
170
-
171
-
172
-
173
-
174
-
175
-
176
-
177
-
178
-
179
-
180
-
181
-
182
-
183
-
184
-
185
-
186
-
187
-
188
-
189
-
190
-
191
-
192
-
193
-
194
-
195
-
196
-
197
-
198
-
199
-
200
-
201
-
202
-
203
-
204
-
205
-
206
-
207
-
208
-
209
-
210
-
211
-
212
-
213
-
214
-
215
-
216
-
217
-
218
-
219
-
220
-
221
-
222
-
223
-
224
-
225
-
226
-
227
-
228
-
229
-
230
-
231
-
232
 |
 |

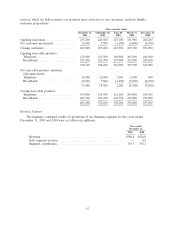
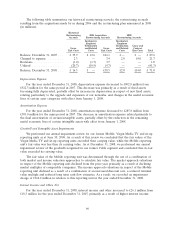
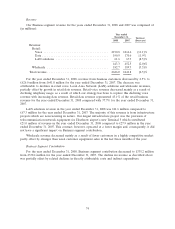
The following table summarizes our historical restructuring accruals, the restructuring accruals
resulting from the acquisitions made by us during 2006 and the restructuring plan announced in 2008
(in millions):
Historical
Restructuring 2006 Acquisition 2008
Accruals Restructuring Accruals Restructuring Accruals
Involuntary Involuntary
Employee Employee
Termination Termination Lease and
Lease and Related Lease and Related Contract
Exit Costs Costs Exit Costs Costs Exit Costs Total
Balance, December 31, 2007 . . . £ 35.9 £ 12.6 £41.1 £ — £ — £ 89.6
Charged to expense ......... 2.3 — 3.4 2.0 14.0 21.7
Revisions ................. (1.0) (1.7) 3.7 — — 1.0
Utilized .................. (20.7) (10.9) (9.7) — — (41.3)
Balance, December 31, 2008 . . . £ 16.5 £ — £38.5 £2.0 £14.0 £ 71.0
Depreciation Expense
For the year ended December 31, 2008, depreciation expense decreased to £902.8 million from
£922.3 million for the same period in 2007. This decrease was primarily as a result of fixed assets
becoming fully depreciated, partially offset by increases in depreciation in respect of new fixed assets,
relating particularly to the upgrade and expansion of our networks, and changes in the useful economic
lives of certain asset categories with effect from January 1, 2008.
Amortization Expense
For the year ended December 31, 2008, amortization expense decreased to £285.8 million from
£301.0 million for the same period in 2007. The decrease in amortization expense related primarily to
the final amortization of certain intangible assets, partially offset by the reduction in the remaining
useful economic lives of certain intangible assets with effect from January 1, 2008.
Goodwill and Intangible Asset Impairments
We performed our annual impairment review for our former Mobile, Virgin Media TV and sit-up
reporting units as at June 30, 2008. As a result of this review we concluded that the fair values of the
Virgin Media TV and sit-up reporting units exceeded their carrying value, while the Mobile reporting
unit’s fair value was less than its carrying value. As at December 31, 2008, we performed our annual
impairment review of the goodwill recognized in our former Cable segment and concluded that its fair
value exceeded its carrying value.
The fair value of the Mobile reporting unit was determined through the use of a combination of
both market and income valuation approaches to calculate fair value. The market approach valuations
in respect of the Mobile reporting unit declined from the prior year primarily as a result of declining
market multiples of comparable companies. The income approach valuations in respect of the Mobile
reporting unit declined as a result of a combination of an increased discount rate, a reduced terminal
value multiple and reduced long term cash flow estimates. As a result, we recorded an impairment
charge of £362.2 million in relation to this reporting unit in the year ended December 31, 2008.
Interest Income and Other, Net
For the year ended December 31, 2008, interest income and other increased to £26.1 million from
£18.3 million for the year ended December 31, 2007, primarily as a result of higher interest income
66