Virgin Media 2009 Annual Report Download - page 54
Download and view the complete annual report
Please find page 54 of the 2009 Virgin Media annual report below. You can navigate through the pages in the report by either clicking on the pages listed below, or by using the keyword search tool below to find specific information within the annual report.-
 1
1 -
2
-
3
-
4
-
5
-
6
-
7
-
8
-
9
-
10
-
11
-
12
-
13
-
14
-
15
-
16
-
17
-
18
-
19
-
20
-
21
-
22
-
23
-
24
-
25
-
26
-
27
-
28
-
29
-
30
-
31
-
32
-
33
-
34
-
35
-
36
-
37
-
38
-
39
-
40
-
41
-
42
-
43
-
 44
44 -
 45
45 -
 46
46 -
 47
47 -
 48
48 -
 49
49 -
 50
50 -
 51
51 -
 52
52 -
 53
53 -
 54
54 -
 55
55 -
 56
56 -
 57
57 -
 58
58 -
 59
59 -
 60
60 -
 61
61 -
 62
62 -
 63
63 -
 64
64 -
65
-
66
-
67
-
68
-
69
-
70
-
71
-
72
-
73
-
74
-
75
-
76
-
77
-
78
-
79
-
80
-
81
-
82
-
83
-
84
-
85
-
86
-
87
-
88
-
89
-
90
-
91
-
92
-
93
-
94
-
95
-
96
-
97
-
98
-
99
-
100
-
101
-
102
-
103
-
104
-
105
-
106
-
107
-
108
-
109
-
110
-
111
-
112
-
113
-
114
-
115
-
116
-
117
-
118
-
119
-
120
-
121
-
122
-
123
-
124
-
125
-
126
-
127
-
128
-
129
-
130
-
131
-
132
-
133
-
134
-
135
-
136
-
137
-
138
-
139
-
140
-
141
-
142
-
143
-
144
-
145
-
146
-
147
-
148
-
149
-
150
-
151
-
152
-
153
-
154
-
155
-
156
-
157
-
158
-
159
-
160
-
161
-
162
-
163
-
164
-
165
-
166
-
167
-
168
-
169
-
170
-
171
-
172
-
173
-
174
-
175
-
176
-
177
-
178
-
179
-
180
-
181
-
182
-
183
-
184
-
185
-
186
-
187
-
188
-
189
-
190
-
191
-
192
-
193
-
194
-
195
-
196
-
197
-
198
-
199
-
200
-
201
-
202
-
203
-
204
-
205
-
206
-
207
-
208
-
209
-
210
-
211
-
212
-
213
-
214
-
215
-
216
-
217
-
218
-
219
-
220
-
221
-
222
-
223
-
224
-
225
-
226
-
227
-
228
-
229
-
230
-
231
-
232
 |
 |

modified after the adoption date. Early adoption is permitted provided that the revised guidance is
retroactively applied to the beginning of the year of adoption. We have not yet adopted the provisions
of this guidance and are evaluating the impact on our consolidated financial statements.
Consolidated Results of Operations
Consolidated Results of Operations for the Years Ended December 31, 2009 and 2008
Revenue
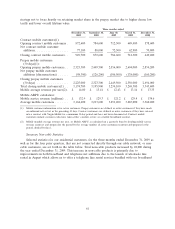
For the year ended December 31, 2009, revenue increased by 0.7% to £3,804.4 million from
£3,776.8 million for the same period in 2008. This increase was primarily due to higher revenue in our
Consumer segment driven by increased cable revenue partially offset by decreases in mobile and non-
cable revenues, and in our Content segment primarily due to increased carriage revenue from BSkyB,
partially offset by reduced TV advertising revenue. The increase was partially offset by lower Business
segment revenue. See further discussion of our Consumer, Business and Content segments below.
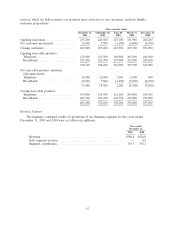
Operating Costs
Operating costs for the years ended December 31, 2009 and 2008 were as follows (in millions):
Year ended
December 31, Increase/
2009 2008 (Decrease)
Operating costs:
Consumer cost of sales ....................... £ 941.3 £ 927.1 1.5%
Business cost of sales ......................... 180.0 223.8 (19.6)
Content cost of sales ......................... 119.5 117.0 2.1
Network and other operating costs ............... 394.9 379.2 4.1
Total operating costs ......................... £1,635.7 £1,647.1 (0.7)%
For the year ended December 31, 2009, operating costs, including network expenses, decreased
slightly to £1,635.7 million from £1,647.1 million during the same period in 2008. This decrease was
primarily attributable to decreased Business segment cost of sales partially offset by increased network
and other operating costs as well as increased Consumer segment and Content segment cost of sales.
Business segment cost of sales declined as a result of reduced Business segment revenues particularly in
respect of LAN solutions infrastructure projects and wholesale contracts and voice customers. Network
and other operating costs increased primarily as a result of increased facilities and other expenses
partially offset by reduced employee and outsourcing costs. Consumer segment cost of sales increased
primarily as a result of increased costs of BSkyB’s basic and premium TV services and the cost of
wireless routers that we began selling to our residential customers during 2008, partially offset by
reduced interconnect costs as a result of lower usage of fixed line telephony services.
52