Virgin Media 2009 Annual Report Download - page 70
Download and view the complete annual report
Please find page 70 of the 2009 Virgin Media annual report below. You can navigate through the pages in the report by either clicking on the pages listed below, or by using the keyword search tool below to find specific information within the annual report.-
 1
1 -
2
-
3
-
4
-
5
-
6
-
7
-
8
-
9
-
10
-
11
-
12
-
13
-
14
-
15
-
16
-
17
-
18
-
19
-
20
-
21
-
22
-
23
-
24
-
25
-
26
-
27
-
28
-
29
-
30
-
31
-
32
-
33
-
34
-
35
-
36
-
37
-
38
-
39
-
40
-
41
-
42
-
43
-
44
-
45
-
46
-
47
-
48
-
49
-
50
-
51
-
52
-
53
-
54
-
55
-
56
-
57
-
58
-
59
-
 60
60 -
 61
61 -
 62
62 -
 63
63 -
 64
64 -
 65
65 -
 66
66 -
 67
67 -
 68
68 -
 69
69 -
 70
70 -
 71
71 -
 72
72 -
 73
73 -
 74
74 -
 75
75 -
 76
76 -
 77
77 -
 78
78 -
 79
79 -
 80
80 -
81
-
82
-
83
-
84
-
85
-
86
-
87
-
88
-
89
-
90
-
91
-
92
-
93
-
94
-
95
-
96
-
97
-
98
-
99
-
100
-
101
-
102
-
103
-
104
-
105
-
106
-
107
-
108
-
109
-
110
-
111
-
112
-
113
-
114
-
115
-
116
-
117
-
118
-
119
-
120
-
121
-
122
-
123
-
124
-
125
-
126
-
127
-
128
-
129
-
130
-
131
-
132
-
133
-
134
-
135
-
136
-
137
-
138
-
139
-
140
-
141
-
142
-
143
-
144
-
145
-
146
-
147
-
148
-
149
-
150
-
151
-
152
-
153
-
154
-
155
-
156
-
157
-
158
-
159
-
160
-
161
-
162
-
163
-
164
-
165
-
166
-
167
-
168
-
169
-
170
-
171
-
172
-
173
-
174
-
175
-
176
-
177
-
178
-
179
-
180
-
181
-
182
-
183
-
184
-
185
-
186
-
187
-
188
-
189
-
190
-
191
-
192
-
193
-
194
-
195
-
196
-
197
-
198
-
199
-
200
-
201
-
202
-
203
-
204
-
205
-
206
-
207
-
208
-
209
-
210
-
211
-
212
-
213
-
214
-
215
-
216
-
217
-
218
-
219
-
220
-
221
-
222
-
223
-
224
-
225
-
226
-
227
-
228
-
229
-
230
-
231
-
232
 |
 |

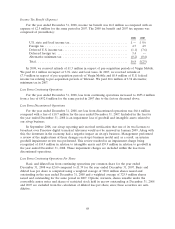
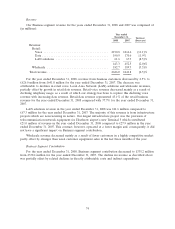
Income Tax Benefit (Expense)
For the year ended December 31, 2008, income tax benefit was £6.8 million as compared with an
expense of £2.5 million for the same period in 2007. The 2008 tax benefit and 2007 tax expense was
comprised of (in millions):
2008 2007
U.S. state and local income tax ................................. £— £0.6
Foreign tax ............................................... 4.7 4.9
Deferred U.S. income tax ..................................... (1.1) (7.6)
Deferred foreign tax ........................................ 3.4 —
Alternative minimum tax ..................................... (0.2) (0.4)
Total .................................................... £6.8 £(2.5)
In 2008, we received refunds of £1.3 million in respect of pre-acquisition periods of Virgin Mobile.
We paid £0.1 million in respect of U.S. state and local taxes. In 2007, we received refunds of
£7.9 million in respect of pre-acquisition periods of Virgin Mobile and £0.4 million of U.S. federal
income tax relating to pre-acquisition periods of Telewest. We paid £0.6 million of U.S alternative
minimum tax in 2007.
Loss From Continuing Operations
For the year ended December 31, 2008, loss from continuing operations increased to £853.4 million
from a loss of £452.8 million for the same period in 2007 due to the factors discussed above.
Loss From Discontinued Operations
For the year ended December 31, 2008, net loss from discontinued operations was £66.6 million
compared with a loss of £10.7 million for the year ended December 31, 2007. Included in the loss for
the year ended December 31, 2008 is an impairment loss of goodwill and intangible assets related to
our sit-up business.
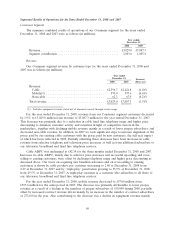
In September 2008, our sit-up reporting unit received notification that one of its two licenses to
broadcast over Freeview digital terrestrial television would not be renewed in January 2009. Along with
this, the downturn in the economy had a negative impact on sit-up’s business. Management performed
a review of the implications of these changes on sit-up’s business model and, as a result, an interim
goodwill impairment review was performed. This review resulted in an impairment charge being
recognized of £14.9 million in relation to intangible assets and £39.9 million in relation to goodwill in
the year ended December 31, 2008. These impairment charges are included within the loss from
discontinued operations.
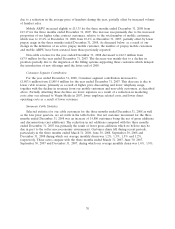
Loss From Continuing Operations Per Share
Basic and diluted loss from continuing operations per common share for the year ended
December 31, 2008 was £2.60 compared to £1.39 for the year ended December 31, 2007. Basic and
diluted loss per share is computed using a weighted average of 328.0 million shares issued and
outstanding in the year ended December 31, 2008 and a weighted average of 325.9 million shares
issued and outstanding for the same period in 2007. Options, warrants, shares issuable under the
convertible senior notes and shares of restricted stock held in escrow outstanding at December 31, 2008
and 2007 are excluded from the calculation of diluted loss per share, since these securities are anti-
dilutive.
68