Virgin Media 2009 Annual Report Download - page 197
Download and view the complete annual report
Please find page 197 of the 2009 Virgin Media annual report below. You can navigate through the pages in the report by either clicking on the pages listed below, or by using the keyword search tool below to find specific information within the annual report.-
 1
1 -
2
-
3
-
4
-
5
-
6
-
7
-
8
-
9
-
10
-
11
-
12
-
13
-
14
-
15
-
16
-
17
-
18
-
19
-
20
-
21
-
22
-
23
-
24
-
25
-
26
-
27
-
28
-
29
-
30
-
31
-
32
-
33
-
34
-
35
-
36
-
37
-
38
-
39
-
40
-
41
-
42
-
43
-
44
-
45
-
46
-
47
-
48
-
49
-
50
-
51
-
52
-
53
-
54
-
55
-
56
-
57
-
58
-
59
-
60
-
61
-
62
-
63
-
64
-
65
-
66
-
67
-
68
-
69
-
70
-
71
-
72
-
73
-
74
-
75
-
76
-
77
-
78
-
79
-
80
-
81
-
82
-
83
-
84
-
85
-
86
-
87
-
88
-
89
-
90
-
91
-
92
-
93
-
94
-
95
-
96
-
97
-
98
-
99
-
100
-
101
-
102
-
103
-
104
-
105
-
106
-
107
-
108
-
109
-
110
-
111
-
112
-
113
-
114
-
115
-
116
-
117
-
118
-
119
-
120
-
121
-
122
-
123
-
124
-
125
-
126
-
127
-
128
-
129
-
130
-
131
-
132
-
133
-
134
-
135
-
136
-
137
-
138
-
139
-
140
-
141
-
142
-
143
-
144
-
145
-
146
-
147
-
148
-
149
-
150
-
151
-
152
-
153
-
154
-
155
-
156
-
157
-
158
-
159
-
160
-
161
-
162
-
163
-
164
-
165
-
166
-
167
-
168
-
169
-
170
-
171
-
172
-
173
-
174
-
175
-
176
-
177
-
178
-
179
-
180
-
181
-
182
-
183
-
184
-
185
-
186
-
 187
187 -
 188
188 -
 189
189 -
 190
190 -
 191
191 -
 192
192 -
 193
193 -
 194
194 -
 195
195 -
 196
196 -
 197
197 -
 198
198 -
 199
199 -
 200
200 -
 201
201 -
 202
202 -
 203
203 -
 204
204 -
 205
205 -
 206
206 -
 207
207 -
208
-
209
-
210
-
211
-
212
-
213
-
214
-
215
-
216
-
217
-
218
-
219
-
220
-
221
-
222
-
223
-
224
-
225
-
226
-
227
-
228
-
229
-
230
-
231
-
232
 |
 |

VIRGIN MEDIA INVESTMENT HOLDINGS LIMITED AND SUBSIDIARIES
NOTES TO CONSOLIDATED FINANCIAL STATEMENTS (Continued)
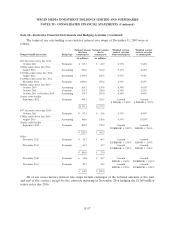
Note 11—Employee Benefit Plans (Continued)
The accumulated benefit obligation for all defined benefit plans was £366.6 million and
£301.4 million at December 31, 2009 and 2008, respectively. As at December 31, 2009 and 2008, all
pension plans had accumulated benefit obligations in excess of plan assets.
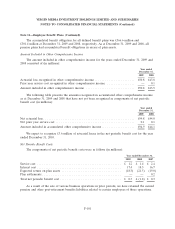
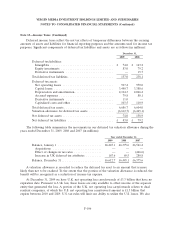
Amount Included in Other Comprehensive Income
The amount included in other comprehensive income for the years ended December 31, 2009 and
2008 consisted of (in millions):
Year ended
December 31,
2009 2008
Actuarial loss recognized in other comprehensive income ....................... £50.8 £43.8
Prior year service cost recognized in other comprehensive income ................ — 0.1
Amount included in other comprehensive income ............................ £50.8 £43.9
The following table presents the amounts recognized in accumulated other comprehensive income
as at December 31, 2009 and 2008 that have not yet been recognized as components of net periodic
benefit cost (in millions):
Year ended
December 31,
2009 2008
Net actuarial loss .................................................... £94.8 £44.0
Net prior year service cost ............................................. 0.1 0.1
Amount included in accumulated other comprehensive income ................... £94.9 £44.1
We expect to recognize £3.6 million of actuarial losses in the net periodic benefit cost for the year
ended December 31, 2010.
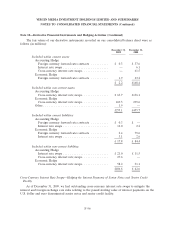
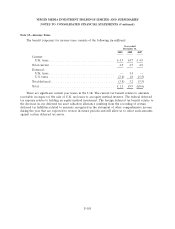
Net Periodic Benefit Costs
The components of net periodic benefit costs were as follows (in millions):
Year ended December 31,
2009 2008 2007
Service cost ................................................ £ 1.2 £ 1.4 £ 2.4
Interest cost ................................................ 17.4 18.3 16.7
Expected return on plan assets .................................. (18.3) (21.5) (19.0)
Plan settlements ............................................. — — 0.2
Total net periodic benefit cost ................................... £ 0.3 £ (1.8) £ 0.3
As a result of the sale of various business operations in prior periods, we have retained the earned
pension and other post-retirement benefits liabilities related to certain employees of those operations.
F-101