Virgin Media 2009 Annual Report Download - page 63
Download and view the complete annual report
Please find page 63 of the 2009 Virgin Media annual report below. You can navigate through the pages in the report by either clicking on the pages listed below, or by using the keyword search tool below to find specific information within the annual report.-
 1
1 -
2
-
3
-
4
-
5
-
6
-
7
-
8
-
9
-
10
-
11
-
12
-
13
-
14
-
15
-
16
-
17
-
18
-
19
-
20
-
21
-
22
-
23
-
24
-
25
-
26
-
27
-
28
-
29
-
30
-
31
-
32
-
33
-
34
-
35
-
36
-
37
-
38
-
39
-
40
-
41
-
42
-
43
-
44
-
45
-
46
-
47
-
48
-
49
-
50
-
51
-
52
-
 53
53 -
 54
54 -
 55
55 -
 56
56 -
 57
57 -
 58
58 -
 59
59 -
 60
60 -
 61
61 -
 62
62 -
 63
63 -
 64
64 -
 65
65 -
 66
66 -
 67
67 -
 68
68 -
 69
69 -
 70
70 -
 71
71 -
 72
72 -
 73
73 -
74
-
75
-
76
-
77
-
78
-
79
-
80
-
81
-
82
-
83
-
84
-
85
-
86
-
87
-
88
-
89
-
90
-
91
-
92
-
93
-
94
-
95
-
96
-
97
-
98
-
99
-
100
-
101
-
102
-
103
-
104
-
105
-
106
-
107
-
108
-
109
-
110
-
111
-
112
-
113
-
114
-
115
-
116
-
117
-
118
-
119
-
120
-
121
-
122
-
123
-
124
-
125
-
126
-
127
-
128
-
129
-
130
-
131
-
132
-
133
-
134
-
135
-
136
-
137
-
138
-
139
-
140
-
141
-
142
-
143
-
144
-
145
-
146
-
147
-
148
-
149
-
150
-
151
-
152
-
153
-
154
-
155
-
156
-
157
-
158
-
159
-
160
-
161
-
162
-
163
-
164
-
165
-
166
-
167
-
168
-
169
-
170
-
171
-
172
-
173
-
174
-
175
-
176
-
177
-
178
-
179
-
180
-
181
-
182
-
183
-
184
-
185
-
186
-
187
-
188
-
189
-
190
-
191
-
192
-
193
-
194
-
195
-
196
-
197
-
198
-
199
-
200
-
201
-
202
-
203
-
204
-
205
-
206
-
207
-
208
-
209
-
210
-
211
-
212
-
213
-
214
-
215
-
216
-
217
-
218
-
219
-
220
-
221
-
222
-
223
-
224
-
225
-
226
-
227
-
228
-
229
-
230
-
231
-
232
 |
 |

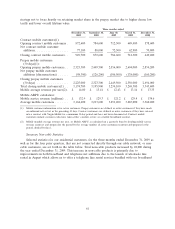
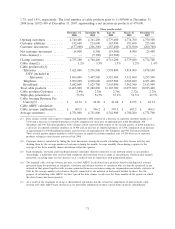
strategy not to focus heavily on retaining market share in the prepay market due to higher churn, low
tariffs and lower overall lifetime value.
Three months ended
December 31, September 30, June 30, March 31, December 31,
2009 2009 2009 2009 2008
Contract mobile customers(1):
Opening contract mobile customers . 872,600 784,600 712,300 649,400 578,600
Net contract mobile customer
additions ................... 77,100 88,000 72,300 62,900 70,800
Closing contract mobile customers . . 949,700 872,600 784,600 712,300 649,400
Prepay mobile customers
(30 days)(1):
Opening prepay mobile customers . . 2,323,300 2,449,500 2,556,000 2,694,000 2,854,200
Net prepay mobile customer
additions (disconnections) ...... (98,300) (126,200) (106,500) (138,000) (160,200)
Closing prepay mobile customers
(30 days) .................. 2,225,000 2,323,300 2,449,500 2,556,000 2,694,000
Total closing mobile customers(1) . . 3,174,700 3,195,900 3,234,100 3,268,300 3,343,400
Mobile average revenue per user(2) . £ 14.00 £ 13.41 £ 12.43 £ 13.14 £ 13.35
Mobile ARPU calculation:
Mobile service revenue (millions) . . £ 132.9 £ 129.3 £ 121.2 £ 129.4 £ 134.6
Average mobile customers ........ 3,164,400 3,213,600 3,251,400 3,283,000 3,360,400
(1) Mobile customer information is for active customers. Prepay customers are defined as active customers if they have made
an outbound call or text in the preceding 30 days. Contract customers are defined as active customers if they have entered
into a contract with Virgin Mobile for a minimum 30-day period and have not been disconnected. Contract mobile
customers include customers who have taken either a mobile service or a mobile broadband contract.
(2) Mobile monthly average revenue per user, or Mobile ARPU, is calculated on a quarterly basis by dividing mobile service
revenue (contract and prepay) for the period by the average number of active customers (contract and prepay) for the
period, divided by three.
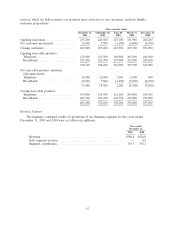
Summary Non-cable Statistics
Selected statistics for our residential customers, for the three months ended December 31, 2009 as
well as for the four prior quarters, that are not connected directly through our cable network, or non-
cable customers, are set forth in the table below. Total non-cable products increased by 48,000 during
the year ended December 31, 2009. This increase in non-cable products is primarily due to
improvements in both broadband and telephone net additions due to the launch of wholesale line
rental in August which allows us to offer a telephone line rental services bundled with our broadband
61