Virgin Media 2009 Annual Report Download - page 72
Download and view the complete annual report
Please find page 72 of the 2009 Virgin Media annual report below. You can navigate through the pages in the report by either clicking on the pages listed below, or by using the keyword search tool below to find specific information within the annual report.-
 1
1 -
2
-
3
-
4
-
5
-
6
-
7
-
8
-
9
-
10
-
11
-
12
-
13
-
14
-
15
-
16
-
17
-
18
-
19
-
20
-
21
-
22
-
23
-
24
-
25
-
26
-
27
-
28
-
29
-
30
-
31
-
32
-
33
-
34
-
35
-
36
-
37
-
38
-
39
-
40
-
41
-
42
-
43
-
44
-
45
-
46
-
47
-
48
-
49
-
50
-
51
-
52
-
53
-
54
-
55
-
56
-
57
-
58
-
59
-
60
-
61
-
 62
62 -
 63
63 -
 64
64 -
 65
65 -
 66
66 -
 67
67 -
 68
68 -
 69
69 -
 70
70 -
 71
71 -
 72
72 -
 73
73 -
 74
74 -
 75
75 -
 76
76 -
 77
77 -
 78
78 -
 79
79 -
 80
80 -
 81
81 -
 82
82 -
83
-
84
-
85
-
86
-
87
-
88
-
89
-
90
-
91
-
92
-
93
-
94
-
95
-
96
-
97
-
98
-
99
-
100
-
101
-
102
-
103
-
104
-
105
-
106
-
107
-
108
-
109
-
110
-
111
-
112
-
113
-
114
-
115
-
116
-
117
-
118
-
119
-
120
-
121
-
122
-
123
-
124
-
125
-
126
-
127
-
128
-
129
-
130
-
131
-
132
-
133
-
134
-
135
-
136
-
137
-
138
-
139
-
140
-
141
-
142
-
143
-
144
-
145
-
146
-
147
-
148
-
149
-
150
-
151
-
152
-
153
-
154
-
155
-
156
-
157
-
158
-
159
-
160
-
161
-
162
-
163
-
164
-
165
-
166
-
167
-
168
-
169
-
170
-
171
-
172
-
173
-
174
-
175
-
176
-
177
-
178
-
179
-
180
-
181
-
182
-
183
-
184
-
185
-
186
-
187
-
188
-
189
-
190
-
191
-
192
-
193
-
194
-
195
-
196
-
197
-
198
-
199
-
200
-
201
-
202
-
203
-
204
-
205
-
206
-
207
-
208
-
209
-
210
-
211
-
212
-
213
-
214
-
215
-
216
-
217
-
218
-
219
-
220
-
221
-
222
-
223
-
224
-
225
-
226
-
227
-
228
-
229
-
230
-
231
-
232
 |
 |
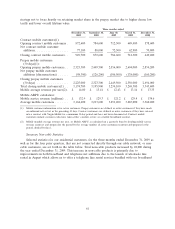
due to a reduction in the average price of handsets during the year, partially offset by increased volume
of handset sales.
Mobile ARPU increased slightly to £13.35 for the three months ended December 31, 2008 from
£13.17 for the three months ended December 31, 2007. The increase was primarily due to the increased
proportion of our higher value contract customers, relative to the total number of mobile customers,
which rose to 19.4% at December 31, 2008 from 10.4% at December 31, 2007, partially offset by lower
prepay usage in the three months ended December 31, 2008. As discussed below, as a result of our
change in the definition of an active prepay mobile customer, the number of prepay mobile customers
and mobile ARPU have been restated from those previously reported.
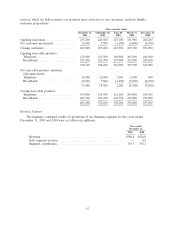
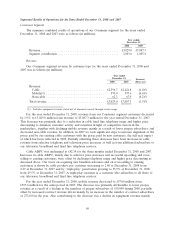
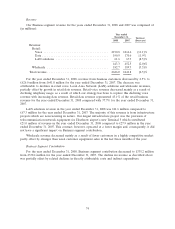
Non-cable revenue for the year ended December 31, 2008 decreased to £62.3 million from
£67.9 million for the year ended December 31, 2007. The decrease was mainly due to a decline in
products partially due to the migration of the billing systems supporting these customers which delayed
the introduction of new offerings until the latter end of 2008.
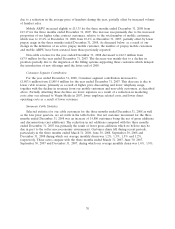
Consumer Segment Contribution
For the year ended December 31, 2008, Consumer segment contribution decreased to
£1,803.6 million from £1,805.4 million for the year ended December 31, 2007. This decrease is due to
lower cable revenue, primarily as a result of higher price discounting and lower telephony usage,
together with the decline in revenues from our mobile customers and non-cable customers, as described
above. Partially offsetting these declines are lower expenses as a result of a reduction in marketing
costs after our rebrand to Virgin Media in 2007, lower employee related costs, and lower direct
operating costs as a result of lower revenues.
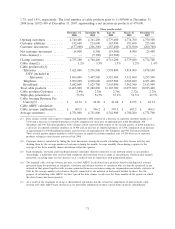
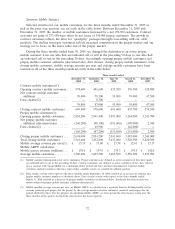
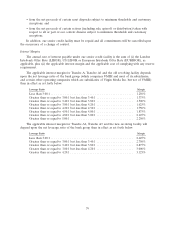
Summary Cable Statistics
Selected statistics for our cable customers for the three months ended December 31, 2008 as well
as the four prior quarters, are set forth in the table below. Our net customer movement for the three
months ended December 31, 2008 was an increase of 14,800 customers being the net of gross additions
and disconnections (net additions). The reduction in net additions compared with the three months
ended December 31, 2007 was primarily the result of fewer gross additions which we believe may be
due in part to the softer macroeconomic environment. Customer churn fell during recent periods,
particularly in the three months ended March 31, 2008, June 30, 2008, September 30, 2008 and
December 31, 2008 during which our average monthly churn was 1.2%, 1.3%, 1.5% and 1.2%,
respectively. These rates compare with the three months ended March 31, 2007, June 30, 2007,
September 30, 2007 and December 31, 2007, during which our average monthly churn was 1.6%, 1.8%,
70