Virgin Media 2009 Annual Report Download - page 43
Download and view the complete annual report
Please find page 43 of the 2009 Virgin Media annual report below. You can navigate through the pages in the report by either clicking on the pages listed below, or by using the keyword search tool below to find specific information within the annual report.-
 1
1 -
2
-
3
-
4
-
5
-
6
-
7
-
8
-
9
-
10
-
11
-
12
-
13
-
14
-
15
-
16
-
17
-
18
-
19
-
20
-
21
-
22
-
23
-
24
-
25
-
26
-
27
-
28
-
29
-
30
-
31
-
32
-
 33
33 -
 34
34 -
 35
35 -
 36
36 -
 37
37 -
 38
38 -
 39
39 -
 40
40 -
 41
41 -
 42
42 -
 43
43 -
 44
44 -
 45
45 -
 46
46 -
 47
47 -
 48
48 -
 49
49 -
 50
50 -
 51
51 -
 52
52 -
 53
53 -
54
-
55
-
56
-
57
-
58
-
59
-
60
-
61
-
62
-
63
-
64
-
65
-
66
-
67
-
68
-
69
-
70
-
71
-
72
-
73
-
74
-
75
-
76
-
77
-
78
-
79
-
80
-
81
-
82
-
83
-
84
-
85
-
86
-
87
-
88
-
89
-
90
-
91
-
92
-
93
-
94
-
95
-
96
-
97
-
98
-
99
-
100
-
101
-
102
-
103
-
104
-
105
-
106
-
107
-
108
-
109
-
110
-
111
-
112
-
113
-
114
-
115
-
116
-
117
-
118
-
119
-
120
-
121
-
122
-
123
-
124
-
125
-
126
-
127
-
128
-
129
-
130
-
131
-
132
-
133
-
134
-
135
-
136
-
137
-
138
-
139
-
140
-
141
-
142
-
143
-
144
-
145
-
146
-
147
-
148
-
149
-
150
-
151
-
152
-
153
-
154
-
155
-
156
-
157
-
158
-
159
-
160
-
161
-
162
-
163
-
164
-
165
-
166
-
167
-
168
-
169
-
170
-
171
-
172
-
173
-
174
-
175
-
176
-
177
-
178
-
179
-
180
-
181
-
182
-
183
-
184
-
185
-
186
-
187
-
188
-
189
-
190
-
191
-
192
-
193
-
194
-
195
-
196
-
197
-
198
-
199
-
200
-
201
-
202
-
203
-
204
-
205
-
206
-
207
-
208
-
209
-
210
-
211
-
212
-
213
-
214
-
215
-
216
-
217
-
218
-
219
-
220
-
221
-
222
-
223
-
224
-
225
-
226
-
227
-
228
-
229
-
230
-
231
-
232
 |
 |

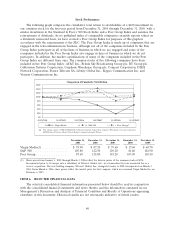
On April 1, 2009, we sold our sit-up reporting unit, which was formerly included within our
Content segment. In accordance with the provisions of the Property, Plant and Equipment Topic of the
Financial Accounting Standards Board, or FASB, Accounting Standards Codification, or ASC we
determined that, as of March 31, 2009, the planned sale of the sit-up business met the requirements for
it to be reflected as assets and liabilities held for sale and discontinued operations in both the current
and prior periods. These consolidated financial statements reflect sit-up as assets and liabilities held for
sale and discontinued operations and we have retrospectively adjusted the balance sheet as of
December 31, 2008 and statements of operations, cash flows and shareholders’ equity for the years
ended December 31, 2008 and 2007.
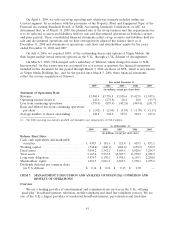
On July 4, 2006, we acquired 100% of the outstanding shares and options of Virgin Mobile, the
then largest mobile virtual network operator in the U.K., through a U.K. Scheme of Arrangement.
On March 3, 2006, NTL merged with a subsidiary of Telewest, which changed its name to NTL
Incorporated. As this transaction was accounted for as a reverse acquisition, the financial statements
included in this document for the period through March 3, 2006 are those of NTL, which is now known
as Virgin Media Holdings Inc., and for the period since March 3, 2006, these financial statements
reflect the reverse acquisition of Telewest.
Year ended December 31,
2009 2008 2007 2006 2005
(in millions, except per share data)
Statement of Operations Data:
Revenue .............................. £3,804.4 £3,776.8 £3,838.6 £3,413.8 £1,947.6
Operating income (loss)(1) ................. 142.0 (271.8) 28.4 20.0 (19.7)
Loss from continuing operations ............. (335.0) (853.4) (452.8) (499.4) (241.7)
Basic and diluted loss from continuing operations
per share ............................ £ (1.02) £ (2.60) £ (1.39) £ (1.70) £ (1.13)
Average number of shares outstanding ......... 328.8 328.0 325.9 292.9 213.8
(1) The 2008 operating loss includes goodwill and intangible asset impairments of £362.2 million.
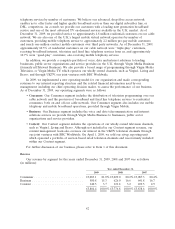
As of December 31,
2009 2008 2007 2006 2005
(in millions, except per share data)
Balance Sheet Data:
Cash, cash equivalents and marketable
securities ........................... £ 430.5 £ 181.6 £ 321.4 £ 418.5 £ 832.1
Working capital ........................ (348.4) (460.1) (488.4) (639.5) 529.9
Fixed assets .......................... 5,049.2 5,342.1 5,649.5 6,020.0 3,294.9
Total assets ........................... 9,187.4 9,933.3 10,503.3 11,278.5 4,988.5
Long term obligations ................... 5,974.7 6,170.1 5,958.5 6,159.1 2,280.0
Shareholders’ equity .................... 1,491.3 2,016.2 2,810.5 3,230.1 1,955.0
Dividends declared per common share
(in U.S. dollars) ...................... $ 0.16 $ 0.16 $ 0.13 $ 0.05 —
ITEM 7. MANAGEMENT’S DISCUSSION AND ANALYSIS OF FINANCIAL CONDITION AND
RESULTS OF OPERATIONS
Overview
We are a leading provider of entertainment and communications services in the U.K., offering
‘‘quad-play’’ broadband internet, television, mobile telephony and fixed line telephony services. We are
one of the U.K.’s largest providers of residential broadband internet, pay television and fixed line
41