Virgin Media 2009 Annual Report Download - page 208
Download and view the complete annual report
Please find page 208 of the 2009 Virgin Media annual report below. You can navigate through the pages in the report by either clicking on the pages listed below, or by using the keyword search tool below to find specific information within the annual report.-
 1
1 -
2
-
3
-
4
-
5
-
6
-
7
-
8
-
9
-
10
-
11
-
12
-
13
-
14
-
15
-
16
-
17
-
18
-
19
-
20
-
21
-
22
-
23
-
24
-
25
-
26
-
27
-
28
-
29
-
30
-
31
-
32
-
33
-
34
-
35
-
36
-
37
-
38
-
39
-
40
-
41
-
42
-
43
-
44
-
45
-
46
-
47
-
48
-
49
-
50
-
51
-
52
-
53
-
54
-
55
-
56
-
57
-
58
-
59
-
60
-
61
-
62
-
63
-
64
-
65
-
66
-
67
-
68
-
69
-
70
-
71
-
72
-
73
-
74
-
75
-
76
-
77
-
78
-
79
-
80
-
81
-
82
-
83
-
84
-
85
-
86
-
87
-
88
-
89
-
90
-
91
-
92
-
93
-
94
-
95
-
96
-
97
-
98
-
99
-
100
-
101
-
102
-
103
-
104
-
105
-
106
-
107
-
108
-
109
-
110
-
111
-
112
-
113
-
114
-
115
-
116
-
117
-
118
-
119
-
120
-
121
-
122
-
123
-
124
-
125
-
126
-
127
-
128
-
129
-
130
-
131
-
132
-
133
-
134
-
135
-
136
-
137
-
138
-
139
-
140
-
141
-
142
-
143
-
144
-
145
-
146
-
147
-
148
-
149
-
150
-
151
-
152
-
153
-
154
-
155
-
156
-
157
-
158
-
159
-
160
-
161
-
162
-
163
-
164
-
165
-
166
-
167
-
168
-
169
-
170
-
171
-
172
-
173
-
174
-
175
-
176
-
177
-
178
-
179
-
180
-
181
-
182
-
183
-
184
-
185
-
186
-
187
-
188
-
189
-
190
-
191
-
192
-
193
-
194
-
195
-
196
-
197
-
 198
198 -
 199
199 -
 200
200 -
 201
201 -
 202
202 -
 203
203 -
 204
204 -
 205
205 -
 206
206 -
 207
207 -
 208
208 -
 209
209 -
 210
210 -
 211
211 -
 212
212 -
 213
213 -
 214
214 -
 215
215 -
 216
216 -
 217
217 -
 218
218 -
219
-
220
-
221
-
222
-
223
-
224
-
225
-
226
-
227
-
228
-
229
-
230
-
231
-
232
 |
 |

VIRGIN MEDIA INVESTMENT HOLDINGS LIMITED AND SUBSIDIARIES
NOTES TO CONSOLIDATED FINANCIAL STATEMENTS (Continued)
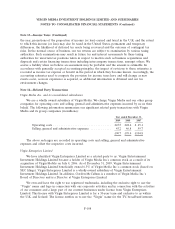
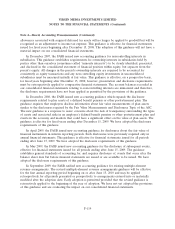
Note 16—Industry Segments (Continued)
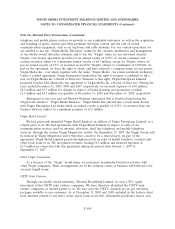
Virgin Media’s Business segment, which was previously part of its Cable segment, comprises its
operations carried out through Virgin Media Business which provides a complete portfolio of voice,
data and internet solutions to leading businesses, public sector organizations and service providers in
the U.K.
Virgin Media operates its Content segment through Virgin Media TV, which supplies television
programming to the U.K. pay-television broadcasting market.
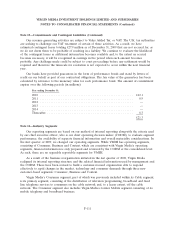
Segment contribution, which is operating income (loss) before network operating costs, corporate
costs, depreciation, amortization, goodwill and intangible asset impairments and restructuring and other
charges, is management’s measure of segment profit. Segment contribution excludes the impact of
certain costs and expenses that are not directly attributable to the reporting segments, such as the costs
of operating the network, corporate costs and depreciation and amortization. Restructuring and other
charges, and goodwill and intangible asset impairments are excluded from segment contribution as
management believes they are not characteristic of our underlying business operations. Assets are
reviewed on a consolidated basis and are not allocated to segments for management reporting since the
primary asset of the business is the cable network infrastructure, which is shared by Virgin Media’s
Consumer and Business segments.
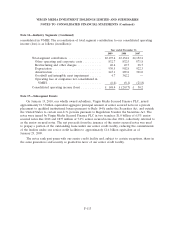
The 2008 and 2007 fiscal year amounts have been adjusted to conform to the current period
presentation. The following segment information is based on the consolidated results of Virgin Media
for the years ended December 31, 2009, 2008 and 2007 (in millions):
Year ended December 31, 2009
Consumer Business Content Total
Revenue ........................... £3,083.1 £580.8 £140.5 £3,804.4
Inter segment revenue ................. — — 27.3 27.3
Segment contribution ................. £1,841.9 £339.7 £ 11.8 £2,193.4
Year ended December 31, 2008
Consumer Business Content Total
Revenue ........................... £3,029.0 £626.0 £121.8 £3,776.8
Inter segment revenue ................. — 0.4 25.7 26.1
Segment contribution ................. £1,803.6 £335.2 £ (4.6) £2,134.2
Year ended December 31, 2007
Consumer Business Content Total
Revenue ........................... £3,087.3 £641.8 £109.5 £3,838.6
Inter segment revenue ................. — 0.4 24.4 24.8
Segment contribution ................. £1,805.4 £338.4 £ 8.4 £2,152.2
Revenues in the table above include £106.1 million, £110.8 million and £114.3 million for the three
years ended December 31, 2009, 2008 and 2007 respectively, related to companies that are not
F-112