Virgin Media 2009 Annual Report Download - page 189
Download and view the complete annual report
Please find page 189 of the 2009 Virgin Media annual report below. You can navigate through the pages in the report by either clicking on the pages listed below, or by using the keyword search tool below to find specific information within the annual report.-
 1
1 -
2
-
3
-
4
-
5
-
6
-
7
-
8
-
9
-
10
-
11
-
12
-
13
-
14
-
15
-
16
-
17
-
18
-
19
-
20
-
21
-
22
-
23
-
24
-
25
-
26
-
27
-
28
-
29
-
30
-
31
-
32
-
33
-
34
-
35
-
36
-
37
-
38
-
39
-
40
-
41
-
42
-
43
-
44
-
45
-
46
-
47
-
48
-
49
-
50
-
51
-
52
-
53
-
54
-
55
-
56
-
57
-
58
-
59
-
60
-
61
-
62
-
63
-
64
-
65
-
66
-
67
-
68
-
69
-
70
-
71
-
72
-
73
-
74
-
75
-
76
-
77
-
78
-
79
-
80
-
81
-
82
-
83
-
84
-
85
-
86
-
87
-
88
-
89
-
90
-
91
-
92
-
93
-
94
-
95
-
96
-
97
-
98
-
99
-
100
-
101
-
102
-
103
-
104
-
105
-
106
-
107
-
108
-
109
-
110
-
111
-
112
-
113
-
114
-
115
-
116
-
117
-
118
-
119
-
120
-
121
-
122
-
123
-
124
-
125
-
126
-
127
-
128
-
129
-
130
-
131
-
132
-
133
-
134
-
135
-
136
-
137
-
138
-
139
-
140
-
141
-
142
-
143
-
144
-
145
-
146
-
147
-
148
-
149
-
150
-
151
-
152
-
153
-
154
-
155
-
156
-
157
-
158
-
159
-
160
-
161
-
162
-
163
-
164
-
165
-
166
-
167
-
168
-
169
-
170
-
171
-
172
-
173
-
174
-
175
-
176
-
177
-
178
-
 179
179 -
 180
180 -
 181
181 -
 182
182 -
 183
183 -
 184
184 -
 185
185 -
 186
186 -
 187
187 -
 188
188 -
 189
189 -
 190
190 -
 191
191 -
 192
192 -
 193
193 -
 194
194 -
 195
195 -
 196
196 -
 197
197 -
 198
198 -
 199
199 -
200
-
201
-
202
-
203
-
204
-
205
-
206
-
207
-
208
-
209
-
210
-
211
-
212
-
213
-
214
-
215
-
216
-
217
-
218
-
219
-
220
-
221
-
222
-
223
-
224
-
225
-
226
-
227
-
228
-
229
-
230
-
231
-
232
 |
 |

VIRGIN MEDIA INVESTMENT HOLDINGS LIMITED AND SUBSIDIARIES
NOTES TO CONSOLIDATED FINANCIAL STATEMENTS (Continued)
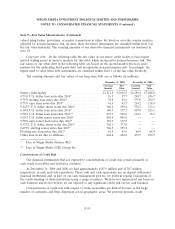
Note 9—Fair Value Measurements (Continued)
valued using broker quotations, or market transactions in either the listed or over-the counter markets,
adjusted for non-performance risk. As such, these derivative instruments are classified within level 2 in
the fair value hierarchy. The carrying amounts of our derivative financial instruments are disclosed in
note 10.
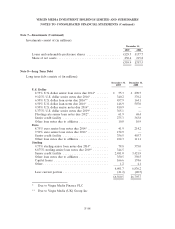
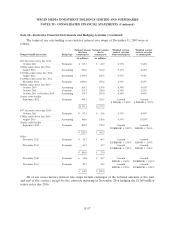
Long term debt: In the following table the fair value of our senior credit facility is based upon
quoted trading prices in inactive markets for this debt, which incorporates non-performance risk. The
fair values of our other debt in the following table are based on the quoted market prices in active
markets for the underlying third party debt and incorporates non-performance risk. Accordingly, the
inputs used to value these debt instruments are classified within level 1 of the fair value hierarchy.
The carrying amounts and fair values of our long term debt are as follows (in millions):
December 31, 2009 December 31, 2008
Carrying Fair Carrying Fair
Amount Value Amount Value
Senior credit facility .............................. £3,112.8 £3,043.5 £4,189.4 £3,048.0
8.75% U.S. dollar loan notes due 2014* ............... 55.3 57.7 290.7 246.7
9.75% sterling loan notes due 2014* .................. 78.8 81.6 375.0 292.5
8.75% euro loan notes due 2014* .................... 41.9 43.7 214.2 158.8
9.125% U.S. dollar senior notes due 2016* ............. 340.2 359.4 376.2 313.1
6.50% U.S. dollar loan notes due 2016* ............... 148.9 177.5 507.0 226.1
6.50% U.S. dollar loan notes due 2016** ............... 457.9 545.6 164.1 73.2
9.50% U.S. dollar senior notes due 2016* .............. 810.9 895.8 — —
9.50% euro senior loan notes due 2016* ............... 152.9 173.5 — —
8.375% U.S. dollar senior notes due 2019* ............. 365.1 377.0 — —
8.875% sterling senior notes due 2019* ................ 344.5 355.3 — —
Floating rate loan notes due 2012* ................... 61.9 61.9 68.4 68.4
Other loan notes due to affiliates .................... 462.8 462.8 472.5 472.5
* Due to Virgin Media Finance PLC
** Due to Virgin Media (UK) Group Inc
Concentrations of Credit Risk
Our financial instruments that are exposed to concentrations of credit risk consist primarily of
cash, trade receivables and derivative contracts.
At December 31, 2009 and 2008, we had approximately £415.9 million and £170.7 million,
respectively, in cash and cash equivalents. These cash and cash equivalents are on deposit with major
financial institutions and, as part of our cash management process, we perform regular evaluations of
the credit standing of these institutions using a range of metrics. We have not experienced any losses in
cash balances and do not believe we are exposed to any significant credit risk on our cash balances.
Concentrations of credit risk with respect to trade receivables are limited because of the large
number of customers and their dispersion across geographic areas. We perform periodic credit
F-93