Virgin Media 2009 Annual Report Download - page 73
Download and view the complete annual report
Please find page 73 of the 2009 Virgin Media annual report below. You can navigate through the pages in the report by either clicking on the pages listed below, or by using the keyword search tool below to find specific information within the annual report.-
 1
1 -
2
-
3
-
4
-
5
-
6
-
7
-
8
-
9
-
10
-
11
-
12
-
13
-
14
-
15
-
16
-
17
-
18
-
19
-
20
-
21
-
22
-
23
-
24
-
25
-
26
-
27
-
28
-
29
-
30
-
31
-
32
-
33
-
34
-
35
-
36
-
37
-
38
-
39
-
40
-
41
-
42
-
43
-
44
-
45
-
46
-
47
-
48
-
49
-
50
-
51
-
52
-
53
-
54
-
55
-
56
-
57
-
58
-
59
-
60
-
61
-
62
-
 63
63 -
 64
64 -
 65
65 -
 66
66 -
 67
67 -
 68
68 -
 69
69 -
 70
70 -
 71
71 -
 72
72 -
 73
73 -
 74
74 -
 75
75 -
 76
76 -
 77
77 -
 78
78 -
 79
79 -
 80
80 -
 81
81 -
 82
82 -
 83
83 -
84
-
85
-
86
-
87
-
88
-
89
-
90
-
91
-
92
-
93
-
94
-
95
-
96
-
97
-
98
-
99
-
100
-
101
-
102
-
103
-
104
-
105
-
106
-
107
-
108
-
109
-
110
-
111
-
112
-
113
-
114
-
115
-
116
-
117
-
118
-
119
-
120
-
121
-
122
-
123
-
124
-
125
-
126
-
127
-
128
-
129
-
130
-
131
-
132
-
133
-
134
-
135
-
136
-
137
-
138
-
139
-
140
-
141
-
142
-
143
-
144
-
145
-
146
-
147
-
148
-
149
-
150
-
151
-
152
-
153
-
154
-
155
-
156
-
157
-
158
-
159
-
160
-
161
-
162
-
163
-
164
-
165
-
166
-
167
-
168
-
169
-
170
-
171
-
172
-
173
-
174
-
175
-
176
-
177
-
178
-
179
-
180
-
181
-
182
-
183
-
184
-
185
-
186
-
187
-
188
-
189
-
190
-
191
-
192
-
193
-
194
-
195
-
196
-
197
-
198
-
199
-
200
-
201
-
202
-
203
-
204
-
205
-
206
-
207
-
208
-
209
-
210
-
211
-
212
-
213
-
214
-
215
-
216
-
217
-
218
-
219
-
220
-
221
-
222
-
223
-
224
-
225
-
226
-
227
-
228
-
229
-
230
-
231
-
232
 |
 |

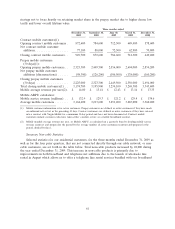
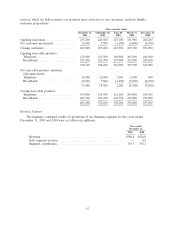
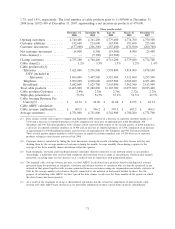
1.7% and 1.4%, respectively. The total number of cable products grew to 11,403,000 at December 31,
2008 from 10,923,400 at December 31, 2007, representing a net increase in products of 479,600.
Three months ended
December 31, September 30, June 30, March 31, December 31,
2008 2008 2008 2008 2007
Opening customers .......... 4,740,400 4,741,200 4,779,600 4,774,700 4,750,300
Customer additions .......... 192,600 214,600 167,900 181,400 225,100
Customer disconnects ........ (177,800) (206,300) (187,400) (176,500) (200,700)
Net customer movement ...... 14,800 8,300 (19,500) 4,900 24,400
Data cleanse(1) ............. — (9,100) (18,900) — —
Closing customers ........... 4,755,200 4,740,400 4,741,200 4,779,600 4,774,700
Cable churn(2) ............. 1.2% 1.5% 1.3% 1.2% 1.4%
Cable products(1)(3):
Television ............... 3,621,000 3,576,500 3,538,800 3,514,900 3,478,100
DTV (included in
Television) ........... 3,469,000 3,407,900 3,353,500 3,311,400 3,253,500
Telephone ............... 4,099,200 4,078,600 4,063,500 4,060,400 4,031,400
Broadband ............... 3,682,800 3,625,700 3,563,400 3,502,300 3,413,900
Total cable products ......... 11,403,000 11,280,800 11,165,700 11,077,600 10,923,400
Cable products/Customer ...... 2.40x 2.38x 2.36x 2.32x 2.29x
Triple-play penetration ........ 55.9% 54.7% 53.1% 51.3% 49.5%
Cable Average Revenue Per
User(4)(5) ............... £ 42.34 £ 42.00 £ 41.68 £ 41.95 £ 42.34
Cable ARPU calculation:
Cable revenue (millions)(5) .... £ 603.5 £ 596.2 £ 595.5 £ 601.5 £ 606.1
Average customers .......... 4,751,000 4,731,800 4,762,900 4,780,200 4,771,700
(1) Data cleanse activity with respect to August and September 2008 resulted in a decrease in reported customer numbers of
9,100 and a decrease in reported products of 6,800, comprised of decreases of approximately 6,400 Broadband, 300
Telephone and 100 Television products. Data cleanse activity reported with respect to the second quarter of 2008 resulted in
a decrease in reported customer numbers of 18,900 and an increase in reported products of 5,300, comprised of an increase
of approximately 6,500 Broadband products and decreases of approximately 300 Telephone and 900 Television products.
These second quarter figures included a 4,600 decrease in reported customer numbers and a 9,200 decrease in reported
products relating to data cleanse activity in July 2008.
(2) Customer churn is calculated by taking the total disconnects during the month (excluding any data cleanse activity) and
dividing them by the average number of customers during the month. Average monthly churn during a quarter is the
average of the three monthly churn calculations within the quarter.
(3) Each telephone, television and broadband internet subscriber directly connected to our network counts as one product.
Accordingly, a subscriber who receives both telephone and television service counts as two products. Products may include
subscribers receiving some services for free or at a reduced rate in connection with promotional offers.
(4) The monthly cable average revenue per user, or cable ARPU, is calculated on a quarterly basis by dividing total revenue
generated from the provision of telephone, television and internet services to customers who are directly connected to our
network in that period together with revenue generated from our customers using our virginmedia.com website, exclusive of
VAT, by the average number of customers directly connected to our network in that period divided by three. For the
purpose of calculating cable ARPU, we have spread the data cleanse evenly over the three months of the quarter in which
the data cleanse has been reported.
(5) As a result of the treatment of sit-up as discontinued operations and the retroactive adjustment of prior periods, cable
revenue and cable ARPU have increased as we previously eliminated revenues earned from sit-up on consolidation.
71