Virgin Media 2009 Annual Report Download - page 138
Download and view the complete annual report
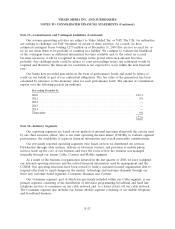
Please find page 138 of the 2009 Virgin Media annual report below. You can navigate through the pages in the report by either clicking on the pages listed below, or by using the keyword search tool below to find specific information within the annual report.-
 1
1 -
2
-
3
-
4
-
5
-
6
-
7
-
8
-
9
-
10
-
11
-
12
-
13
-
14
-
15
-
16
-
17
-
18
-
19
-
20
-
21
-
22
-
23
-
24
-
25
-
26
-
27
-
28
-
29
-
30
-
31
-
32
-
33
-
34
-
35
-
36
-
37
-
38
-
39
-
40
-
41
-
42
-
43
-
44
-
45
-
46
-
47
-
48
-
49
-
50
-
51
-
52
-
53
-
54
-
55
-
56
-
57
-
58
-
59
-
60
-
61
-
62
-
63
-
64
-
65
-
66
-
67
-
68
-
69
-
70
-
71
-
72
-
73
-
74
-
75
-
76
-
77
-
78
-
79
-
80
-
81
-
82
-
83
-
84
-
85
-
86
-
87
-
88
-
89
-
90
-
91
-
92
-
93
-
94
-
95
-
96
-
97
-
98
-
99
-
100
-
101
-
102
-
103
-
104
-
105
-
106
-
107
-
108
-
109
-
110
-
111
-
112
-
113
-
114
-
115
-
116
-
117
-
118
-
119
-
120
-
121
-
122
-
123
-
124
-
125
-
126
-
127
-
 128
128 -
 129
129 -
 130
130 -
 131
131 -
 132
132 -
 133
133 -
 134
134 -
 135
135 -
 136
136 -
 137
137 -
 138
138 -
 139
139 -
 140
140 -
 141
141 -
 142
142 -
 143
143 -
 144
144 -
 145
145 -
 146
146 -
 147
147 -
 148
148 -
149
-
150
-
151
-
152
-
153
-
154
-
155
-
156
-
157
-
158
-
159
-
160
-
161
-
162
-
163
-
164
-
165
-
166
-
167
-
168
-
169
-
170
-
171
-
172
-
173
-
174
-
175
-
176
-
177
-
178
-
179
-
180
-
181
-
182
-
183
-
184
-
185
-
186
-
187
-
188
-
189
-
190
-
191
-
192
-
193
-
194
-
195
-
196
-
197
-
198
-
199
-
200
-
201
-
202
-
203
-
204
-
205
-
206
-
207
-
208
-
209
-
210
-
211
-
212
-
213
-
214
-
215
-
216
-
217
-
218
-
219
-
220
-
221
-
222
-
223
-
224
-
225
-
226
-
227
-
228
-
229
-
230
-
231
-
232
 |
 |

VIRGIN MEDIA INC. AND SUBSIDIARIES
NOTES TO CONSOLIDATED FINANCIAL STATEMENTS (Continued)
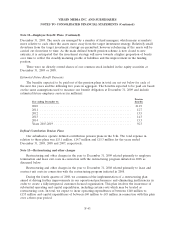
Note 12—Employee Benefit Plans (Continued)
Accordingly, the information disclosed in the tables above includes amounts relating to liabilities of
these employees.
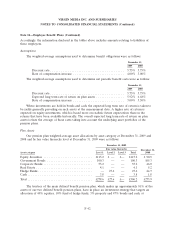
Assumptions
The weighted-average assumptions used to determine benefit obligations were as follows:
December 31,
2009 2008
Discount rate .......................................... 5.75% 5.75%
Rate of compensation increase ............................. 4.00% 3.00%
The weighted-average assumptions used to determine net periodic benefit costs were as follows:
December 31,
2009 2008
Discount rate .......................................... 5.75% 5.75%
Expected long term rate of return on plan assets ................ 5.92% 6.68%
Rate of compensation increase ............................. 3.00% 3.50%
Where investments are held in bonds and cash, the expected long term rate of return is taken to
be yields generally prevailing on such assets at the measurement date. A higher rate of return is
expected on equity investments, which is based more on realistic future expectations than on the
returns that have been available historically. The overall expected long term rate of return on plan
assets is then the average of these rates taking into account the underlying asset portfolios of the
pension plans.
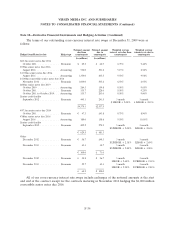
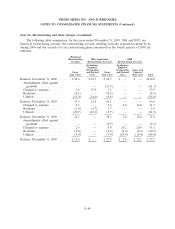
Plan Assets
Our pension plan weighted-average asset allocations by asset category at December 31, 2009 and
2008 and by fair value hierarchy level at December 31, 2009 were as follows:
December 31, 2009
Fair value hierarchy December 31,
Asset category Level 1 Level 2 Level 3 Total 2008
Equity Securities ............................ £115.2 £ — £— £115.2 £ 90.9
Government Bonds .......................... 100.3 — — 100.3 105.3
Corporate Bonds ............................ 55.2 — — 55.2 46.0
Real Estate ................................ 4.1 — — 4.1 5.2
Hedge Funds ............................... — 27.6 — 27.6 24.7
Cash ..................................... 3.8 — — 3.8 1.8
Total ..................................... £278.6 £27.6 £— £306.2 £273.9
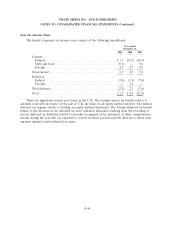
The trustees of the main defined benefit pension plan, which makes up approximately 81% of the
assets of our two defined benefit pension plans, have in place an investment strategy that targets an
allocation of 40% equities, 10% fund of hedge funds, 3% property and 47% bonds and cash, at
F-42