Virgin Media 2009 Annual Report Download - page 126
Download and view the complete annual report
Please find page 126 of the 2009 Virgin Media annual report below. You can navigate through the pages in the report by either clicking on the pages listed below, or by using the keyword search tool below to find specific information within the annual report.-
 1
1 -
2
-
3
-
4
-
5
-
6
-
7
-
8
-
9
-
10
-
11
-
12
-
13
-
14
-
15
-
16
-
17
-
18
-
19
-
20
-
21
-
22
-
23
-
24
-
25
-
26
-
27
-
28
-
29
-
30
-
31
-
32
-
33
-
34
-
35
-
36
-
37
-
38
-
39
-
40
-
41
-
42
-
43
-
44
-
45
-
46
-
47
-
48
-
49
-
50
-
51
-
52
-
53
-
54
-
55
-
56
-
57
-
58
-
59
-
60
-
61
-
62
-
63
-
64
-
65
-
66
-
67
-
68
-
69
-
70
-
71
-
72
-
73
-
74
-
75
-
76
-
77
-
78
-
79
-
80
-
81
-
82
-
83
-
84
-
85
-
86
-
87
-
88
-
89
-
90
-
91
-
92
-
93
-
94
-
95
-
96
-
97
-
98
-
99
-
100
-
101
-
102
-
103
-
104
-
105
-
106
-
107
-
108
-
109
-
110
-
111
-
112
-
113
-
114
-
115
-
 116
116 -
 117
117 -
 118
118 -
 119
119 -
 120
120 -
 121
121 -
 122
122 -
 123
123 -
 124
124 -
 125
125 -
 126
126 -
 127
127 -
 128
128 -
 129
129 -
 130
130 -
 131
131 -
 132
132 -
 133
133 -
 134
134 -
 135
135 -
 136
136 -
137
-
138
-
139
-
140
-
141
-
142
-
143
-
144
-
145
-
146
-
147
-
148
-
149
-
150
-
151
-
152
-
153
-
154
-
155
-
156
-
157
-
158
-
159
-
160
-
161
-
162
-
163
-
164
-
165
-
166
-
167
-
168
-
169
-
170
-
171
-
172
-
173
-
174
-
175
-
176
-
177
-
178
-
179
-
180
-
181
-
182
-
183
-
184
-
185
-
186
-
187
-
188
-
189
-
190
-
191
-
192
-
193
-
194
-
195
-
196
-
197
-
198
-
199
-
200
-
201
-
202
-
203
-
204
-
205
-
206
-
207
-
208
-
209
-
210
-
211
-
212
-
213
-
214
-
215
-
216
-
217
-
218
-
219
-
220
-
221
-
222
-
223
-
224
-
225
-
226
-
227
-
228
-
229
-
230
-
231
-
232
 |
 |

VIRGIN MEDIA INC. AND SUBSIDIARIES
NOTES TO CONSOLIDATED FINANCIAL STATEMENTS (Continued)
Note 9—Fair Value Measurements (Continued)
In estimating the fair value of our other financial instruments, we used the following methods and
assumptions:
Cash and cash equivalents, and restricted cash: The carrying amounts reported in the consolidated
balance sheets approximate fair value due to the short maturity and nature of these financial
instruments.
Derivative financial instruments: As a result of our financing activities, we are exposed to market
risks from changes in interest and foreign currency exchange rates, which may adversely affect our
operating results and financial position. When deemed appropriate, we minimize our risks from interest
and foreign currency exchange rate fluctuations through the use of derivative financial instruments. The
foreign currency forward rate contracts, interest rate swaps and cross-currency interest rate swaps are
valued using counterparty valuations, or market transactions in either the listed or over-the-counter
markets, adjusted for non-performance risk. As such, these derivative instruments are classified within
level 2 in the fair value hierarchy. The carrying amounts of our derivative financial instruments are
disclosed in note 10.
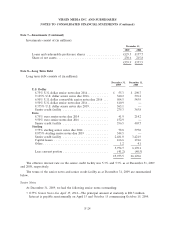
Long term debt: In the following table the fair value of our senior credit facility is based upon
quoted trading prices in inactive markets for this debt, which incorporates non-performance risk, and is
classified within level 2 of the fair value hierarchy. The fair values of our other debt in the following
table are based on the quoted market prices in active markets and incorporate non-performance risk.
Accordingly, the inputs used to value these debt instruments are classified within level 1 of the fair
value hierarchy.
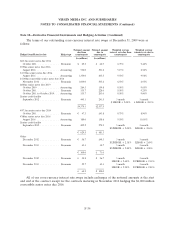
The carrying amounts and fair values of our long term debt are as follows (in millions):
December 31, 2009 December 31, 2008
Carrying Fair Carrying Fair
Amount Value Amount Value
Senior credit facility .............................. £3,112.8 £3,043.5 £4,189.4 £3,048.0
8.75% U.S. dollar senior notes due 2014 ............... 55.3 57.7 290.7 246.7
9.75% sterling senior notes due 2014 .................. 78.8 81.6 375.0 292.5
8.75% euro senior notes due 2014 .................... 41.9 43.7 214.2 158.8
9.125% U.S. dollar senior notes due 2016 .............. 340.2 359.4 376.2 313.1
6.50% U.S. dollar convertible senior notes due 2016 ...... 504.5 737.0 545.9 305.1
9.50% U.S. dollar senior notes due 2016 ............... 810.9 895.8 — —
9.50% euro senior notes due 2016 .................... 152.9 173.5 — —
8.375% U.S. dollar senior notes due 2019 .............. 365.1 377.0 — —
8.875% sterling senior notes due 2019 ................. 344.5 355.3 — —
Concentrations of Credit Risk
Our financial instruments that are exposed to concentrations of credit risk consist primarily of
cash, trade receivables and derivative contracts.
At December 31, 2009 and 2008, we had £430.5 million and £181.6 million, respectively, in cash
and cash equivalents. These cash and cash equivalents are on deposit with major financial institutions
and, as part of our cash management process, we perform regular evaluations of the credit standing of
F-30