Virgin Media 2009 Annual Report Download - page 42
Download and view the complete annual report
Please find page 42 of the 2009 Virgin Media annual report below. You can navigate through the pages in the report by either clicking on the pages listed below, or by using the keyword search tool below to find specific information within the annual report.-
 1
1 -
2
-
3
-
4
-
5
-
6
-
7
-
8
-
9
-
10
-
11
-
12
-
13
-
14
-
15
-
16
-
17
-
18
-
19
-
20
-
21
-
22
-
23
-
24
-
25
-
26
-
27
-
28
-
29
-
30
-
31
-
 32
32 -
 33
33 -
 34
34 -
 35
35 -
 36
36 -
 37
37 -
 38
38 -
 39
39 -
 40
40 -
 41
41 -
 42
42 -
 43
43 -
 44
44 -
 45
45 -
 46
46 -
 47
47 -
 48
48 -
 49
49 -
 50
50 -
 51
51 -
 52
52 -
53
-
54
-
55
-
56
-
57
-
58
-
59
-
60
-
61
-
62
-
63
-
64
-
65
-
66
-
67
-
68
-
69
-
70
-
71
-
72
-
73
-
74
-
75
-
76
-
77
-
78
-
79
-
80
-
81
-
82
-
83
-
84
-
85
-
86
-
87
-
88
-
89
-
90
-
91
-
92
-
93
-
94
-
95
-
96
-
97
-
98
-
99
-
100
-
101
-
102
-
103
-
104
-
105
-
106
-
107
-
108
-
109
-
110
-
111
-
112
-
113
-
114
-
115
-
116
-
117
-
118
-
119
-
120
-
121
-
122
-
123
-
124
-
125
-
126
-
127
-
128
-
129
-
130
-
131
-
132
-
133
-
134
-
135
-
136
-
137
-
138
-
139
-
140
-
141
-
142
-
143
-
144
-
145
-
146
-
147
-
148
-
149
-
150
-
151
-
152
-
153
-
154
-
155
-
156
-
157
-
158
-
159
-
160
-
161
-
162
-
163
-
164
-
165
-
166
-
167
-
168
-
169
-
170
-
171
-
172
-
173
-
174
-
175
-
176
-
177
-
178
-
179
-
180
-
181
-
182
-
183
-
184
-
185
-
186
-
187
-
188
-
189
-
190
-
191
-
192
-
193
-
194
-
195
-
196
-
197
-
198
-
199
-
200
-
201
-
202
-
203
-
204
-
205
-
206
-
207
-
208
-
209
-
210
-
211
-
212
-
213
-
214
-
215
-
216
-
217
-
218
-
219
-
220
-
221
-
222
-
223
-
224
-
225
-
226
-
227
-
228
-
229
-
230
-
231
-
232
 |
 |
24FEB201017571412
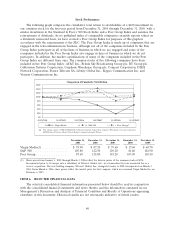
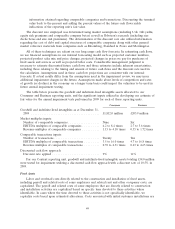
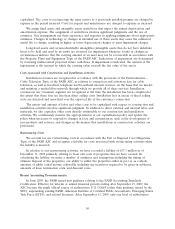
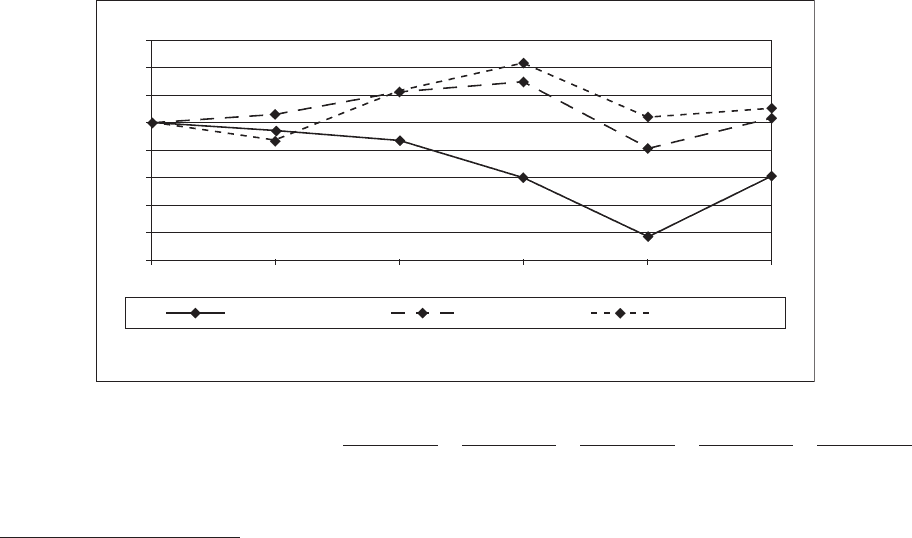
Stock Performance
The following graph compares the cumulative total return to stockholders of a $100 investment in
our common stock for the five-year period from December 31, 2005 through December 31, 2009, with a
similar investment in the Standard & Poor’s 500 Stock Index and a Peer Group Index and assumes the
reinvestment of dividends. As no published index of comparable companies currently reports values on
a dividends reinvested basis, we have created a Peer Group Index for purposes of this graph in
accordance with the requirements of the SEC. The Peer Group Index is made up of companies that are
engaged in the telecommunications business, although not all of the companies included in the Peer
Group Index participate in all of the lines of business in which we are engaged and some of the
companies included in the Peer Group Index also engage in lines of business in which we do not
participate. In addition, the market capitalizations of many of the companies included in the Peer
Group Index are different from ours. The common stocks of the following companies have been
included in the Peer Group Index: AT&T Inc., British Sky Broadcasting Group plc, BT Group plc,
Cablevision Systems Corporation, Carphone Warehouse Group plc, Comcast Corporation, DISH
Network Corporation, France Telecom SA, Liberty Global Inc., Rogers Communication Inc. and
Verizon Communications Inc.
Comparison of Cumulative Total Return
$0
$20
$40
$60
$80
$100
$120
$140
$160
01/01/2005 31/12/2005 31/12/2006 31/12/2007 31/12/2008 31/12/2009
Virgin Media S&P 500 Peer Group
(1)
(1) Peer Group consists of AT&T, BSkyB, BT, Cablevision Systems Corporation, Carphone Warehouse, Comcast Corporation,
DISH, France Telecom, Liberty Global, Rogers Communication and Verizon.
December 31, December 31, December 31, December 31, December 31,
2005 2006 2007 2008 2009
Virgin Media(1) ............... $ 93.90 $ 87.20 $ 59.60 $ 17.60 $ 60.70
S&P 500 .................... 105.80 122.50 129.20 81.40 102.90
Peer Group .................. 87.60 124.00 143.20 103.90 110.50
(1) Share prices from January 1, 2005 through March 3, 2006 reflect the historic prices of the common stock of NTL
Incorporated prior to its merger into a subsidiary of Telewest Global, Inc., in a transaction that was accounted for as a
reverse acquisition. The new holding company, Telewest Global, Inc., changed its name to NTL Incorporated on March 3,
2006. From March 6, 2006, share prices reflect the market price for that company, which was renamed Virgin Media Inc. on
February 6, 2007.
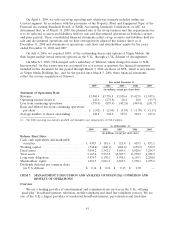
ITEM 6. SELECTED FINANCIAL DATA
The selected consolidated financial information presented below should be read in conjunction
with the consolidated financial statements and notes thereto and the information contained in our
Management’s Discussion and Analysis of Financial Condition and Results of Operations appearing
elsewhere in this document. Historical results are not necessarily indicative of future results.
40