US Airways 2011 Annual Report Download - page 97
Download and view the complete annual report
Please find page 97 of the 2011 US Airways annual report below. You can navigate through the pages in the report by either clicking on the pages listed below, or by using the keyword search tool below to find specific information within the annual report.-
 1
1 -
2
-
3
-
4
-
5
-
6
-
7
-
8
-
9
-
10
-
11
-
12
-
13
-
14
-
15
-
16
-
17
-
18
-
19
-
20
-
21
-
22
-
23
-
24
-
25
-
26
-
27
-
28
-
29
-
30
-
31
-
32
-
33
-
34
-
35
-
36
-
37
-
38
-
39
-
40
-
41
-
42
-
43
-
44
-
45
-
46
-
47
-
48
-
49
-
50
-
51
-
52
-
53
-
54
-
55
-
56
-
57
-
58
-
59
-
60
-
61
-
62
-
63
-
64
-
65
-
66
-
67
-
68
-
69
-
70
-
71
-
72
-
73
-
74
-
75
-
76
-
77
-
78
-
79
-
80
-
81
-
82
-
83
-
84
-
85
-
86
-
 87
87 -
 88
88 -
 89
89 -
 90
90 -
 91
91 -
 92
92 -
 93
93 -
 94
94 -
 95
95 -
 96
96 -
 97
97 -
 98
98 -
 99
99 -
 100
100 -
 101
101 -
 102
102 -
 103
103 -
 104
104 -
 105
105 -
 106
106 -
 107
107 -
108
-
109
-
110
-
111
-
112
-
113
-
114
-
115
-
116
-
117
-
118
-
119
-
120
-
121
-
122
-
123
-
124
-
125
-
126
-
127
-
128
-
129
-
130
-
131
-
132
-
133
-
134
-
135
-
136
-
137
-
138
-
139
-
140
-
141
-
142
-
143
-
144
-
145
-
146
-
147
-
148
-
149
-
150
-
151
-
152
-
153
-
154
-
155
-
156
-
157
-
158
-
159
-
160
-
161
-
162
-
163
-
164
-
165
-
166
-
167
-
168
-
169
-
170
-
171
 |
 |

Table of Contents
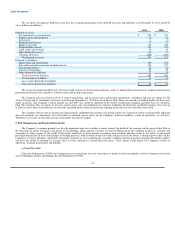
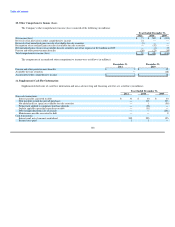
The following table details the Company's loss (gain) on fuel hedging instruments, net (in millions):
Year Ended Year Ended Year Ended
December 31, December 31, December 31,
2011 2010 2009
Realized loss $ — $ — $ 382
Unrealized gain — — (375)
Loss on fuel hedging instruments, net $ — $ — $ 7
The unrealized gains in 2009 were related to the reversal of prior period unrealized losses due to contracts settling in 2009.
(b) Credit Risk
Investments in Marketable Securities
During 2011, the Company sold its remaining investments in auction rate securities for cash proceeds of $52 million, resulting in the reversal of
$3 million of prior period net unrealized gains from other comprehensive income and $2 million of realized losses recorded in other nonoperating expense,
net. With this sale, the Company has now liquidated its entire investment in auction rate securities.
During 2010, the Company sold certain investments in auction rate securities for cash proceeds of $145 million, resulting in $53 million of net realized
gains recorded in other nonoperating expense, net, of which $52 million represents the reclassification of prior period net unrealized gains from other
comprehensive income as determined on a specific-identification basis. Additionally, the Company recorded net unrealized losses of $1 million in other
comprehensive income related to the decline in fair value of certain investments in auction rate securities, which offset previously recognized unrealized
gains.
During 2009, the Company sold certain investments in auction rate securities for cash proceeds of $32 million. Additionally, the Company recorded net
unrealized gains of $58 million in other comprehensive income related to the increase in fair value of certain investments in auction rate securities, as well as
$10 million in other-than-temporary impairment charges recorded in other nonoperating expense, net related to the decline in fair value of certain investments
in auction rate securities.
Accounts Receivable
Most of the Company's receivables relate to tickets sold to individual passengers through the use of major credit cards or to tickets sold by other airlines
and used by passengers on US Airways or its regional airline affiliates. These receivables are short-term, mostly being settled within seven days after sale.
Bad debt losses, which have been minimal in the past, have been considered in establishing allowances for doubtful accounts. The Company does not believe
it is subject to any significant concentration of credit risk.
(c) Interest Rate Risk
The Company has exposure to market risk associated with changes in interest rates related primarily to its variable rate debt obligations. Interest rates
on $2.77 billion principal amount of long-term debt as of December 31, 2011 are subject to adjustment to reflect changes in floating interest rates. The
weighted average effective interest rate on the Company's variable rate debt was 3.5% at December 31, 2011.
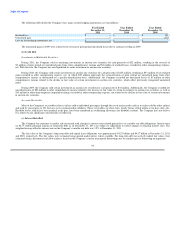
The fair value of the Company's long-term debt and capital lease obligations was approximately $4.23 billion and $4.37 billion at December 31, 2011
and 2010, respectively. The fair values were estimated using quoted market prices where available. For long-term debt not actively traded, fair values were
estimated using a discounted cash flow analysis, based on the Company's current incremental borrowing rates for similar types of borrowing arrangements.
94