US Airways 2011 Annual Report Download - page 137
Download and view the complete annual report
Please find page 137 of the 2011 US Airways annual report below. You can navigate through the pages in the report by either clicking on the pages listed below, or by using the keyword search tool below to find specific information within the annual report.-
 1
1 -
2
-
3
-
4
-
5
-
6
-
7
-
8
-
9
-
10
-
11
-
12
-
13
-
14
-
15
-
16
-
17
-
18
-
19
-
20
-
21
-
22
-
23
-
24
-
25
-
26
-
27
-
28
-
29
-
30
-
31
-
32
-
33
-
34
-
35
-
36
-
37
-
38
-
39
-
40
-
41
-
42
-
43
-
44
-
45
-
46
-
47
-
48
-
49
-
50
-
51
-
52
-
53
-
54
-
55
-
56
-
57
-
58
-
59
-
60
-
61
-
62
-
63
-
64
-
65
-
66
-
67
-
68
-
69
-
70
-
71
-
72
-
73
-
74
-
75
-
76
-
77
-
78
-
79
-
80
-
81
-
82
-
83
-
84
-
85
-
86
-
87
-
88
-
89
-
90
-
91
-
92
-
93
-
94
-
95
-
96
-
97
-
98
-
99
-
100
-
101
-
102
-
103
-
104
-
105
-
106
-
107
-
108
-
109
-
110
-
111
-
112
-
113
-
114
-
115
-
116
-
117
-
118
-
119
-
120
-
121
-
122
-
123
-
124
-
125
-
126
-
 127
127 -
 128
128 -
 129
129 -
 130
130 -
 131
131 -
 132
132 -
 133
133 -
 134
134 -
 135
135 -
 136
136 -
 137
137 -
 138
138 -
 139
139 -
 140
140 -
 141
141 -
 142
142 -
 143
143 -
 144
144 -
 145
145 -
 146
146 -
 147
147 -
148
-
149
-
150
-
151
-
152
-
153
-
154
-
155
-
156
-
157
-
158
-
159
-
160
-
161
-
162
-
163
-
164
-
165
-
166
-
167
-
168
-
169
-
170
-
171
 |
 |

Table of Contents
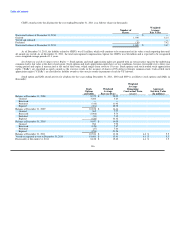
(b) Subsidiaries of US Airways Group
The net payable to US Airways Group's wholly owned subsidiaries consists of amounts due under regional capacity agreements with the other airline
subsidiaries and fuel purchase arrangements with a non-airline subsidiary.
US Airways purchases all of the capacity generated by US Airways Group's wholly owned regional airline subsidiaries at a rate per ASM that is
periodically determined by US Airways and, concurrently, recognizes revenues that result primarily from passengers being carried by these affiliated
companies. The rate per ASM that US Airways pays is based on estimates of the costs incurred to supply the capacity. US Airways recognized Express
capacity purchase expense for the years ended December 31, 2011, 2010 and 2009 of $566 million, $460 million and $451 million, respectively, related to this
program.
US Airways provides various services to these regional airlines, including passenger handling, maintenance and catering. US Airways recognized other
operating revenues for the years ended December 31, 2011, 2010 and 2009 of $88 million, $89 million and $87 million, respectively, related to these services.
These regional airlines also perform passenger and ground handling services for US Airways at certain airports, for which US Airways recognized other
operating expenses for the years ended December 31, 2011, 2010 and 2009 of $176 million, $158 million and $142 million, respectively. US Airways also
leases or subleases certain aircraft to these regional airline subsidiaries. US Airways recognized other operating revenues of $78 million related to these
arrangements for each of the years ended December 31, 2011, 2010 and 2009, respectively.
US Airways purchases a portion of its aviation fuel from US Airways Group's wholly owned subsidiary, MSC, which acts as a fuel wholesaler to US
Airways in certain circumstances. For the years ended December 31, 2011, 2010 and 2009, MSC sold fuel totaling $1.34 billion, $879 million and
$677 million, respectively, used by US Airways' mainline and Express flights.
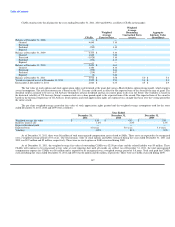
12. Operating Segments and Related Disclosures
US Airways is managed as a single business unit that provides air transportation for passengers and cargo. This allows it to benefit from an integrated
revenue pricing and route network that includes US Airways, US Airways Group's wholly owned regional air carriers and third-party carriers that fly under
capacity purchase or prorate agreements as part of US Airways' Express operations. The flight equipment of all these carriers is combined to form one fleet
that is deployed through a single route scheduling system. When making resource allocation decisions, the chief operating decision maker evaluates flight
profitability data, which considers aircraft type and route economics, but gives no weight to the financial impact of the resource allocation decision on an
individual carrier basis. The objective in making resource allocation decisions is to maximize consolidated financial results, not the individual results of US
Airways and US Airways Express.
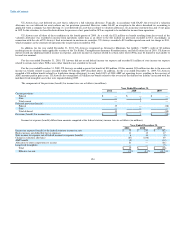
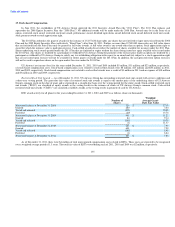
Information concerning operating revenues in principal geographic areas is as follows (in millions):
Year Ended Year Ended Year Ended
December 31, December 31, December 31,
2011 2010 2009
United States $ 9,862 $ 9,305 $ 8,405
Foreign 3,346 2,750 2,204
Total $ 13,208 $ 12,055 $ 10,609
US Airways attributes operating revenues by geographic region based upon the origin and destination of each flight segment. US Airways' tangible
assets consist primarily of flight equipment, which are mobile across geographic markets and, therefore, have not been allocated.
134