US Airways 2011 Annual Report Download - page 57
Download and view the complete annual report
Please find page 57 of the 2011 US Airways annual report below. You can navigate through the pages in the report by either clicking on the pages listed below, or by using the keyword search tool below to find specific information within the annual report.-
 1
1 -
2
-
3
-
4
-
5
-
6
-
7
-
8
-
9
-
10
-
11
-
12
-
13
-
14
-
15
-
16
-
17
-
18
-
19
-
20
-
21
-
22
-
23
-
24
-
25
-
26
-
27
-
28
-
29
-
30
-
31
-
32
-
33
-
34
-
35
-
36
-
37
-
38
-
39
-
40
-
41
-
42
-
43
-
44
-
45
-
46
-
 47
47 -
 48
48 -
 49
49 -
 50
50 -
 51
51 -
 52
52 -
 53
53 -
 54
54 -
 55
55 -
 56
56 -
 57
57 -
 58
58 -
 59
59 -
 60
60 -
 61
61 -
 62
62 -
 63
63 -
 64
64 -
 65
65 -
 66
66 -
 67
67 -
68
-
69
-
70
-
71
-
72
-
73
-
74
-
75
-
76
-
77
-
78
-
79
-
80
-
81
-
82
-
83
-
84
-
85
-
86
-
87
-
88
-
89
-
90
-
91
-
92
-
93
-
94
-
95
-
96
-
97
-
98
-
99
-
100
-
101
-
102
-
103
-
104
-
105
-
106
-
107
-
108
-
109
-
110
-
111
-
112
-
113
-
114
-
115
-
116
-
117
-
118
-
119
-
120
-
121
-
122
-
123
-
124
-
125
-
126
-
127
-
128
-
129
-
130
-
131
-
132
-
133
-
134
-
135
-
136
-
137
-
138
-
139
-
140
-
141
-
142
-
143
-
144
-
145
-
146
-
147
-
148
-
149
-
150
-
151
-
152
-
153
-
154
-
155
-
156
-
157
-
158
-
159
-
160
-
161
-
162
-
163
-
164
-
165
-
166
-
167
-
168
-
169
-
170
-
171
 |
 |

Table of Contents
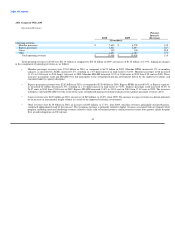
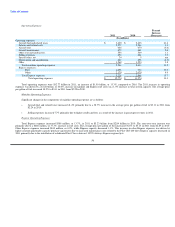
For the year ended December 31, 2011, US Airways recorded a special non-cash tax charge of $21 million in connection with the sale of its final
investment in auction rate securities in July 2011. This charge recognizes in the statement of operations the tax provision that was recorded in other
comprehensive income, a subset of stockholder's equity, in the fourth quarter of 2009. In addition, US Airways recognized an AMT credit of $2 million
resulting from its elections under applicable sections of the Tax Relief, Unemployment Insurance Reauthorization, and Job Creation Act of 2010. For the year
ended December 31, 2011, US Airways did not record any additional federal income tax expense, and state income tax expense related to certain states where
NOLs may be limited or unavailable to be used was nominal.
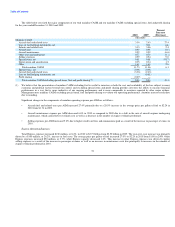
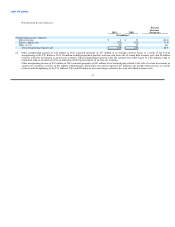
For the year ended December 31, 2010, US Airways did not record federal income tax expense and recorded $1 million of state income tax expense
related to certain states where NOLs were either limited or not available to be used.
For the year ended December 31, 2009, US Airways recorded a special tax benefit of $38 million. Of this amount, $21 million was due to a non-cash
income tax benefit related to gains recorded within other comprehensive income during 2009 due to an increase in fair value of certain investments in auction
rate securities. In addition, US Airways recorded a $14 million tax benefit related to a legislation change allowing it to carry back 100% of 2008 AMT net
operating losses, resulting in the recovery of AMT amounts paid in prior years. US Airways also recognized a $3 million tax benefit related to the reversal of
the deferred tax liability associated with the indefinite lived intangible assets that were impaired during 2009.
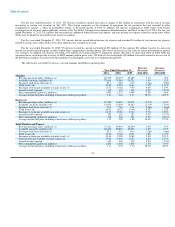
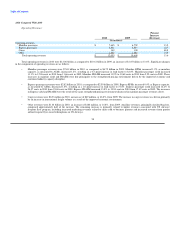
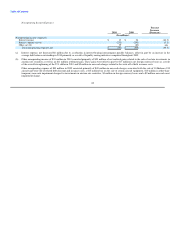
The table below sets forth US Airways' selected mainline and Express operating data:
Increase Increase
Year Ended December 31, (Decrease) (Decrease)
2011 2010 2009 2011-2010 2010-2009
Mainline
Revenue passenger miles (millions) (a) 60,779 58,977 57,889 3.1% 1.9%
Available seat miles (millions) (b) 72,603 71,588 70,725 1.4% 1.2%
Passenger load factor (percent) (c) 83.7 82.4 81.9 1.3pts 0.5pts
Yield (cents) (d) 13.99 12.96 11.66 7.9% 11.1%
Passenger revenue per available seat mile (cents) (e) 11.71 10.68 9.55 9.6% 11.9%
Aircraft at end of period 340 339 349 0.3% (2.9)%
Fuel consumption (gallons in millions) 1,095 1,073 1,069 2.0% 0.4%
Average aircraft fuel price including related taxes (dollars per gallon) 3.11 2.24 1.74 38.7% 28.5%
Express (f)
Revenue passenger miles (millions) (a) 10,542 10,616 10,570 (0.7)% 0.4%
Available seat miles (millions) (b) 14,070 14,230 14,367 (1.1)% (1.0)%
Passenger load factor (percent) (c) 74.9 74.6 73.6 0.3pts 1.0pts
Yield (cents) (d) 29.03 26.57 23.68 9.3% 12.2%
Passenger revenue per available seat mile (cents) (e) 21.75 19.83 17.42 9.7% 13.8%
Aircraft at end of period 283 281 283 0.7% (0.7)%
Fuel consumption (gallons in millions) 338 336 338 0.5% (0.6)%
Average aircraft fuel price including related taxes (dollars per gallon) 3.13 2.29 1.80 36.6% 27.3%
Total Mainline and Express
Revenue passenger miles (millions) (a) 71,321 69,593 68,459 2.5% 1.7%
Available seat miles (millions) (b) 86,673 85,818 85,092 1.0% 0.9%
Passenger load factor (percent) (c) 82.3 81.1 80.5 1.2pts 0.6pts
Yield (cents) (d) 16.21 15.04 13.52 7.8% 11.2%
Passenger revenue per available seat mile (cents) (e) 13.34 12.20 10.88 9.4% 12.1%
Total revenue per available seat mile (cents) (g) 15.24 14.05 12.47 8.5% 12.7%
Aircraft at end of period 623 620 632 0.5% (1.9)%
Fuel consumption (gallons in millions) 1,433 1,409 1,407 1.7% 0.1%
Average aircraft fuel price including related taxes (dollars per gallon) 3.11 2.25 1.76 38.2% 28.2%
54