US Airways 2011 Annual Report Download - page 56
Download and view the complete annual report
Please find page 56 of the 2011 US Airways annual report below. You can navigate through the pages in the report by either clicking on the pages listed below, or by using the keyword search tool below to find specific information within the annual report.-
 1
1 -
2
-
3
-
4
-
5
-
6
-
7
-
8
-
9
-
10
-
11
-
12
-
13
-
14
-
15
-
16
-
17
-
18
-
19
-
20
-
21
-
22
-
23
-
24
-
25
-
26
-
27
-
28
-
29
-
30
-
31
-
32
-
33
-
34
-
35
-
36
-
37
-
38
-
39
-
40
-
41
-
42
-
43
-
44
-
45
-
 46
46 -
 47
47 -
 48
48 -
 49
49 -
 50
50 -
 51
51 -
 52
52 -
 53
53 -
 54
54 -
 55
55 -
 56
56 -
 57
57 -
 58
58 -
 59
59 -
 60
60 -
 61
61 -
 62
62 -
 63
63 -
 64
64 -
 65
65 -
 66
66 -
67
-
68
-
69
-
70
-
71
-
72
-
73
-
74
-
75
-
76
-
77
-
78
-
79
-
80
-
81
-
82
-
83
-
84
-
85
-
86
-
87
-
88
-
89
-
90
-
91
-
92
-
93
-
94
-
95
-
96
-
97
-
98
-
99
-
100
-
101
-
102
-
103
-
104
-
105
-
106
-
107
-
108
-
109
-
110
-
111
-
112
-
113
-
114
-
115
-
116
-
117
-
118
-
119
-
120
-
121
-
122
-
123
-
124
-
125
-
126
-
127
-
128
-
129
-
130
-
131
-
132
-
133
-
134
-
135
-
136
-
137
-
138
-
139
-
140
-
141
-
142
-
143
-
144
-
145
-
146
-
147
-
148
-
149
-
150
-
151
-
152
-
153
-
154
-
155
-
156
-
157
-
158
-
159
-
160
-
161
-
162
-
163
-
164
-
165
-
166
-
167
-
168
-
169
-
170
-
171
 |
 |

Table of Contents
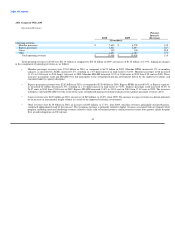
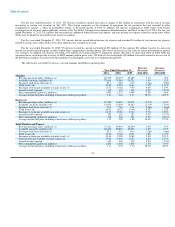
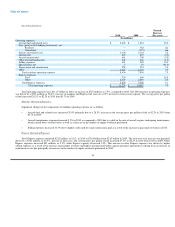
US Airways' Results of Operations
In 2011, US Airways realized operating income of $434 million and income before income taxes of $199 million. US Airways experienced higher
revenues in 2011 due to the strong pricing environment resulting from ongoing industry capacity discipline and robust consumer demand for air travel, which
substantially offset a significant increase in fuel costs. US Airways' 2011 results were also impacted by recognition of $17 million in net special charges.
In 2010, US Airways realized operating income of $781 million and income before income taxes of $600 million. US Airways experienced growth in
revenues in 2010 driven by higher yields as a result of the improved economy and industry capacity discipline. US Airways' 2010 results were also impacted
by recognition of $54 million in net special credits.
In 2009, US Airways realized operating income of $122 million and a loss before income taxes of $178 million. US Airways experienced significant
declines in revenues in 2009 as a result of the global economic recession. US Airways' 2009 results were also impacted by recognition of $259 million in net
special credits.
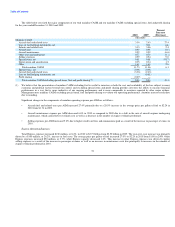
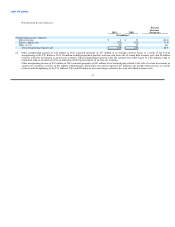
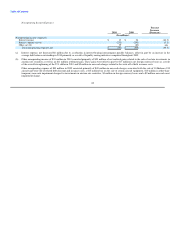
The table below presents US Airways' pre-tax special charges (credits) (in millions):
Year Ended December 31,
2011 2010 2009
Mainline operating special items, net (a) $ 24 $ 5 $ 55
Unrealized mark-to-market gain on fuel hedging instruments, net — — (375)
Nonoperating special items, net (b) (7) (59) 61
Total $ 17 $ (54) $ (259)
(a) The 2011 period consisted of $21 million in legal costs incurred in connection with the Delta Slot transaction and auction rate securities arbitration as
well as $3 million in severance costs.
The 2010 period consisted of $6 million in non-cash charge related to the decline in value of certain spare parts, $5 million in aircraft costs related to
capacity reductions and other net special charges of $10 million, which included a settlement and corporate transaction costs. These costs were offset in
part by a $16 million refund of ASIF previously paid to the TSA during the years 2005 to 2009.
The 2009 period consisted of $22 million in aircraft costs as a result of capacity reductions, $16 million in non-cash impairment charges due to the
decline in fair value of certain indefinite lived intangible assets associated with international routes, $11 million in severance and other charges and
$6 million in costs incurred related to the 2009 liquidity improvement program.
(b) The 2011 period consisted of a $15 million credit in connection with an award received in an arbitration involving investments in auction rate
securities, offset in part by $6 million in debt prepayment penalties and non-cash write offs of certain debt issuance costs as well as $2 million of losses
related to investments in auction rate securities.
The 2010 period consisted of $53 million of net realized gains related to the sale of certain investments in auction rate securities as well as an
$11 million settlement gain, offset in part by $5 million in non-cash charges related to the write off of debt issuance costs.
The 2009 period consisted of $49 million in non-cash charges associated with the sale of 10 Embraer 190 aircraft and write off of related debt discount
and issuance costs, $10 million in other-than-temporary non-cash impairment charges for investments in auction rate securities and a $2 million non-
cash asset impairment charge.
At December 31, 2011, US Airways had approximately $1.85 billion of gross NOLs to reduce future federal taxable income. All of US Airways' NOLs
are expected to be available to reduce federal taxable income in the calendar year 2012. The NOLs expire during the years 2024 through 2031. US Airways'
net deferred tax assets, which include $1.78 billion of the NOLs, are subject to a full valuation allowance. US Airways also had approximately $79 million of
tax-effected state NOLs at December 31, 2011. At December 31, 2011, the federal and state valuation allowances were $349 million and $61 million,
respectively. In accordance with generally accepted accounting principles, utilization of the NOLs will result in a corresponding decrease in the valuation
allowance and offset US Airways' tax provision dollar for dollar.
53