US Airways 2011 Annual Report Download - page 53
Download and view the complete annual report
Please find page 53 of the 2011 US Airways annual report below. You can navigate through the pages in the report by either clicking on the pages listed below, or by using the keyword search tool below to find specific information within the annual report.-
 1
1 -
2
-
3
-
4
-
5
-
6
-
7
-
8
-
9
-
10
-
11
-
12
-
13
-
14
-
15
-
16
-
17
-
18
-
19
-
20
-
21
-
22
-
23
-
24
-
25
-
26
-
27
-
28
-
29
-
30
-
31
-
32
-
33
-
34
-
35
-
36
-
37
-
38
-
39
-
40
-
41
-
42
-
 43
43 -
 44
44 -
 45
45 -
 46
46 -
 47
47 -
 48
48 -
 49
49 -
 50
50 -
 51
51 -
 52
52 -
 53
53 -
 54
54 -
 55
55 -
 56
56 -
 57
57 -
 58
58 -
 59
59 -
 60
60 -
 61
61 -
 62
62 -
 63
63 -
64
-
65
-
66
-
67
-
68
-
69
-
70
-
71
-
72
-
73
-
74
-
75
-
76
-
77
-
78
-
79
-
80
-
81
-
82
-
83
-
84
-
85
-
86
-
87
-
88
-
89
-
90
-
91
-
92
-
93
-
94
-
95
-
96
-
97
-
98
-
99
-
100
-
101
-
102
-
103
-
104
-
105
-
106
-
107
-
108
-
109
-
110
-
111
-
112
-
113
-
114
-
115
-
116
-
117
-
118
-
119
-
120
-
121
-
122
-
123
-
124
-
125
-
126
-
127
-
128
-
129
-
130
-
131
-
132
-
133
-
134
-
135
-
136
-
137
-
138
-
139
-
140
-
141
-
142
-
143
-
144
-
145
-
146
-
147
-
148
-
149
-
150
-
151
-
152
-
153
-
154
-
155
-
156
-
157
-
158
-
159
-
160
-
161
-
162
-
163
-
164
-
165
-
166
-
167
-
168
-
169
-
170
-
171
 |
 |

Table of Contents
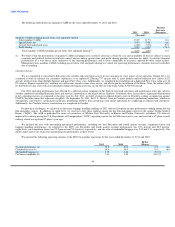
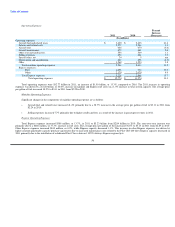
Operating Expenses:
Percent
Increase
2010 2009 (Decrease)
(In millions)
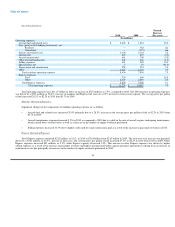
Operating expenses:
Aircraft fuel and related taxes $ 2,403 $ 1,863 29.0
Loss (gain) on fuel hedging instruments, net:
Realized — 382 nm
Unrealized — (375) nm
Salaries and related costs 2,244 2,165 3.6
Aircraft rent 670 695 (3.7)
Aircraft maintenance 661 700 (5.5)
Other rent and landing fees 549 560 (1.9)
Selling expenses 421 382 10.3
Special items, net 5 55 (91.6)
Depreciation and amortization 248 242 2.7
Other 1,197 1,152 3.9
Total mainline operating expenses 8,398 7,821 7.4
Express expenses:
Fuel 769 609 26.2
Other 1,960 1,910 2.7
Total Express expenses 2,729 2,519 8.4
Total operating expenses $ 11,127 $ 10,340 7.6
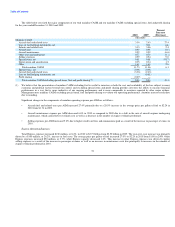
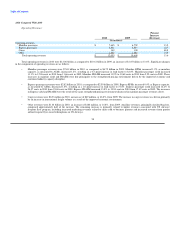
Total operating expenses were $11.13 billion in 2010, an increase of $787 million, or 7.6%, compared to 2009. The 2010 increase in operating expenses
was driven by a $700 million, or 28.3%, increase in mainline and Express fuel costs on a 0.9% increase in total system capacity. The average price per gallon
of fuel increased 28.1% to $2.25 in 2010 from $1.76 in 2009.
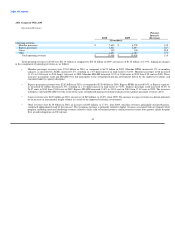
Mainline Operating Expenses per ASM:
Our mainline CASM increased 0.67 cents, or 6.1%, from 11.06 cents in 2009 to 11.73 cents in 2010. Excluding special items, fuel and profit sharing,
our mainline CASM decreased 0.04 cents, or 0.4%, from 8.34 cents in 2009 to 8.30 cents in 2010, while mainline capacity increased 1.2%.
50