US Airways 2011 Annual Report Download - page 37
Download and view the complete annual report
Please find page 37 of the 2011 US Airways annual report below. You can navigate through the pages in the report by either clicking on the pages listed below, or by using the keyword search tool below to find specific information within the annual report.-
 1
1 -
2
-
3
-
4
-
5
-
6
-
7
-
8
-
9
-
10
-
11
-
12
-
13
-
14
-
15
-
16
-
17
-
18
-
19
-
20
-
21
-
22
-
23
-
24
-
25
-
26
-
 27
27 -
 28
28 -
 29
29 -
 30
30 -
 31
31 -
 32
32 -
 33
33 -
 34
34 -
 35
35 -
 36
36 -
 37
37 -
 38
38 -
 39
39 -
 40
40 -
 41
41 -
 42
42 -
 43
43 -
 44
44 -
 45
45 -
 46
46 -
 47
47 -
48
-
49
-
50
-
51
-
52
-
53
-
54
-
55
-
56
-
57
-
58
-
59
-
60
-
61
-
62
-
63
-
64
-
65
-
66
-
67
-
68
-
69
-
70
-
71
-
72
-
73
-
74
-
75
-
76
-
77
-
78
-
79
-
80
-
81
-
82
-
83
-
84
-
85
-
86
-
87
-
88
-
89
-
90
-
91
-
92
-
93
-
94
-
95
-
96
-
97
-
98
-
99
-
100
-
101
-
102
-
103
-
104
-
105
-
106
-
107
-
108
-
109
-
110
-
111
-
112
-
113
-
114
-
115
-
116
-
117
-
118
-
119
-
120
-
121
-
122
-
123
-
124
-
125
-
126
-
127
-
128
-
129
-
130
-
131
-
132
-
133
-
134
-
135
-
136
-
137
-
138
-
139
-
140
-
141
-
142
-
143
-
144
-
145
-
146
-
147
-
148
-
149
-
150
-
151
-
152
-
153
-
154
-
155
-
156
-
157
-
158
-
159
-
160
-
161
-
162
-
163
-
164
-
165
-
166
-
167
-
168
-
169
-
170
-
171
 |
 |

Table of Contents
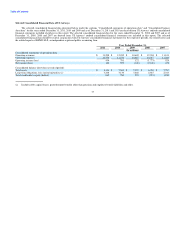
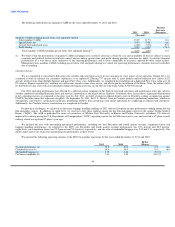
Item 6. Selected Financial Data
Selected Consolidated Financial Data of US Airways Group
The selected consolidated financial data presented below under the captions "Consolidated statements of operations data" and "Consolidated balance
sheet data" for the years ended December 31, 2011, 2010 and 2009 and as of December 31, 2011 and 2010 are derived from US Airways Group's audited
consolidated financial statements included elsewhere in this report. The selected consolidated financial data for the years ended December 31, 2008 and 2007
and as of December 31, 2009, 2008 and 2007 are derived from US Airways Group's audited consolidated financial statements not included in this report. The
selected consolidated financial data should be read in conjunction with US Airways Group's consolidated financial statements for the respective periods, the
related notes and the related reports of KPMG LLP, an independent registered public accounting firm.
Year Ended December 31,
2011 2010 2009 2008 2007
(In millions, except share and per share data)
Consolidated statements of operations data:
Operating revenues $ 13,055 $ 11,908 $ 10,458 $ 12,118 $ 11,700
Operating expenses 12,629 11,127 10,340 13,918 11,167
Operating income (loss) 426 781 118 (1,800) 533
Net income (loss) 71 502 (205) (2,215) 423
Earnings (loss) per common share:
Basic $ 0.44 $ 3.11 $ (1.54) $ (22.11) $ 4.62
Diluted 0.44 2.61 (1.54) (22.11) 4.52
Shares used for computation (in thousands):
Basic 162,028 161,412 133,000 100,168 91,536
Diluted 163,743 201,131 133,000 100,168 95,603
Consolidated balance sheet data (at end of period):
Total assets $ 8,335 $ 7,819 $ 7,454 $ 7,214 $ 8,040
Long-term obligations, less current maturities (a) 4,718 4,559 4,643 4,281 3,654
Total stockholders' equity (deficit) 150 84 (355) (494) 1,455
Consolidated statements of operations data excluding special items (b):
Operating income (loss) excluding special items $ 452 $ 785 $ (199) $ (606) $ 528
Net income (loss) excluding special items 111 447 (499) (808) 436
Earnings (loss) per common share excluding special items:
Basic $ 0.69 $ 2.77 $ (3.75) $ (8.06) $ 4.75
Diluted 0.68 2.34 (3.75) (8.06) 4.65
(a) Includes debt, capital leases, postretirement benefits other than pensions and employee benefit liabilities and other.
(b) See reconciliation of GAAP to non-GAAP financial measures below.
34