US Airways 2011 Annual Report Download - page 35
Download and view the complete annual report
Please find page 35 of the 2011 US Airways annual report below. You can navigate through the pages in the report by either clicking on the pages listed below, or by using the keyword search tool below to find specific information within the annual report.-
 1
1 -
2
-
3
-
4
-
5
-
6
-
7
-
8
-
9
-
10
-
11
-
12
-
13
-
14
-
15
-
16
-
17
-
18
-
19
-
20
-
21
-
22
-
23
-
24
-
 25
25 -
 26
26 -
 27
27 -
 28
28 -
 29
29 -
 30
30 -
 31
31 -
 32
32 -
 33
33 -
 34
34 -
 35
35 -
 36
36 -
 37
37 -
 38
38 -
 39
39 -
 40
40 -
 41
41 -
 42
42 -
 43
43 -
 44
44 -
 45
45 -
46
-
47
-
48
-
49
-
50
-
51
-
52
-
53
-
54
-
55
-
56
-
57
-
58
-
59
-
60
-
61
-
62
-
63
-
64
-
65
-
66
-
67
-
68
-
69
-
70
-
71
-
72
-
73
-
74
-
75
-
76
-
77
-
78
-
79
-
80
-
81
-
82
-
83
-
84
-
85
-
86
-
87
-
88
-
89
-
90
-
91
-
92
-
93
-
94
-
95
-
96
-
97
-
98
-
99
-
100
-
101
-
102
-
103
-
104
-
105
-
106
-
107
-
108
-
109
-
110
-
111
-
112
-
113
-
114
-
115
-
116
-
117
-
118
-
119
-
120
-
121
-
122
-
123
-
124
-
125
-
126
-
127
-
128
-
129
-
130
-
131
-
132
-
133
-
134
-
135
-
136
-
137
-
138
-
139
-
140
-
141
-
142
-
143
-
144
-
145
-
146
-
147
-
148
-
149
-
150
-
151
-
152
-
153
-
154
-
155
-
156
-
157
-
158
-
159
-
160
-
161
-
162
-
163
-
164
-
165
-
166
-
167
-
168
-
169
-
170
-
171
 |
 |

Table of Contents
PART II
Item 5. Market for US Airways Group's Common Equity, Related Stockholder Matters and Issuer Purchases of Equity Securities
Stock Exchange Listing
Our common stock trades on the NYSE under the symbol "LCC." As of February 17, 2012, the closing price of our common stock on the NYSE was
$8.90. As of February 17, 2012, there were 1,656 holders of record of our common stock.
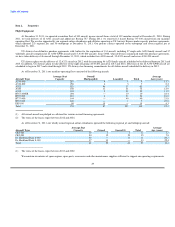
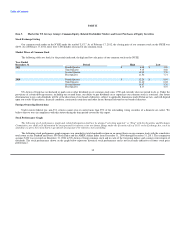
Market Prices of Common Stock
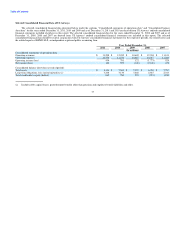
The following table sets forth, for the periods indicated, the high and low sale prices of our common stock on the NYSE:
Year Ended
December 31 Period High Low
2011 Fourth Quarter $ 6.48 $ 3.96
Third Quarter 9.15 4.68
Second Quarter 10.35 7.76
First Quarter 11.56 7.71
2010 Fourth Quarter $ 12.26 $ 8.94
Third Quarter 11.40 8.02
Second Quarter 10.87 5.70
First Quarter 8.17 4.47
US Airways Group has not declared or paid cash or other dividends on its common stock since 1990 and currently does not intend to do so. Under the
provisions of certain debt agreements, including our secured loans, our ability to pay dividends on or repurchase our common stock is restricted. Any future
determination to pay cash dividends will be at the discretion of our board of directors, subject to applicable limitations under Delaware law, and will depend
upon our results of operations, financial condition, contractual restrictions and other factors deemed relevant by our board of directors.
Foreign Ownership Restrictions
Under current federal law, non-U.S. citizens cannot own or control more than 25% of the outstanding voting securities of a domestic air carrier. We
believe that we were in compliance with this statute during the time period covered by this report.
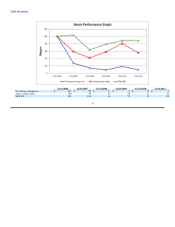
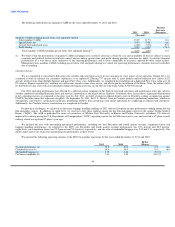
Stock Performance Graph
The following stock performance graph and related information shall not be deemed "soliciting material" or "filed" with the Securities and Exchange
Commission, nor shall such information be incorporated by reference into any future filings under the Securities Act of 1933 or the Exchange Act, each as
amended, except to the extent that we specifically incorporate it by reference into such filing.
The following stock performance graph compares our cumulative total shareholder return on an annual basis on our common stock with the cumulative
total return on the Standard and Poor's 500 Stock Index and the AMEX Airline Index from December 31, 2006 through December 31, 2011. The comparison
assumes $100 was invested on December 31, 2006 in US Airways Group common stock and in each of the foregoing indices and assumes reinvestment of
dividends. The stock performance shown on the graph below represents historical stock performance and is not necessarily indicative of future stock price
performance.
32