US Airways 2011 Annual Report Download - page 106
Download and view the complete annual report
Please find page 106 of the 2011 US Airways annual report below. You can navigate through the pages in the report by either clicking on the pages listed below, or by using the keyword search tool below to find specific information within the annual report.-
 1
1 -
2
-
3
-
4
-
5
-
6
-
7
-
8
-
9
-
10
-
11
-
12
-
13
-
14
-
15
-
16
-
17
-
18
-
19
-
20
-
21
-
22
-
23
-
24
-
25
-
26
-
27
-
28
-
29
-
30
-
31
-
32
-
33
-
34
-
35
-
36
-
37
-
38
-
39
-
40
-
41
-
42
-
43
-
44
-
45
-
46
-
47
-
48
-
49
-
50
-
51
-
52
-
53
-
54
-
55
-
56
-
57
-
58
-
59
-
60
-
61
-
62
-
63
-
64
-
65
-
66
-
67
-
68
-
69
-
70
-
71
-
72
-
73
-
74
-
75
-
76
-
77
-
78
-
79
-
80
-
81
-
82
-
83
-
84
-
85
-
86
-
87
-
88
-
89
-
90
-
91
-
92
-
93
-
94
-
95
-
 96
96 -
 97
97 -
 98
98 -
 99
99 -
 100
100 -
 101
101 -
 102
102 -
 103
103 -
 104
104 -
 105
105 -
 106
106 -
 107
107 -
 108
108 -
 109
109 -
 110
110 -
 111
111 -
 112
112 -
 113
113 -
 114
114 -
 115
115 -
 116
116 -
117
-
118
-
119
-
120
-
121
-
122
-
123
-
124
-
125
-
126
-
127
-
128
-
129
-
130
-
131
-
132
-
133
-
134
-
135
-
136
-
137
-
138
-
139
-
140
-
141
-
142
-
143
-
144
-
145
-
146
-
147
-
148
-
149
-
150
-
151
-
152
-
153
-
154
-
155
-
156
-
157
-
158
-
159
-
160
-
161
-
162
-
163
-
164
-
165
-
166
-
167
-
168
-
169
-
170
-
171
 |
 |

Table of Contents
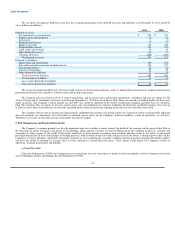
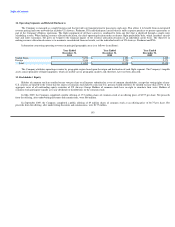
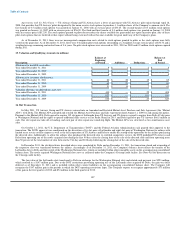
12. Operating Segments and Related Disclosures
The Company is managed as a single business unit that provides air transportation for passengers and cargo. This allows it to benefit from an integrated
revenue pricing and route network that includes US Airways, Piedmont, PSA and third-party carriers that fly under capacity purchase or prorate agreements as
part of the Company's Express operations. The flight equipment of all these carriers is combined to form one fleet that is deployed through a single route
scheduling system. When making resource allocation decisions, the chief operating decision maker evaluates flight profitability data, which considers aircraft
type and route economics, but gives no weight to the financial impact of the resource allocation decision on an individual carrier basis. The objective in
making resource allocation decisions is to maximize consolidated financial results, not the individual results of US Airways, Piedmont and PSA.
Information concerning operating revenues in principal geographic areas is as follows (in millions):
Year Ended Year Ended Year Ended
December 31, December 31, December 31,
2011 2010 2009
United States $ 9,709 $ 9,158 $ 8,285
Foreign 3,346 2,750 2,173
Total $ 13,055 $ 11,908 $ 10,458
The Company attributes operating revenues by geographic region based upon the origin and destination of each flight segment. The Company's tangible
assets consist primarily of flight equipment, which are mobile across geographic markets and, therefore, have not been allocated.
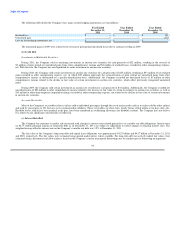
13. Stockholders' Equity
Holders of common stock are entitled to one vote per share on all matters submitted to a vote of common shareholders, except that voting rights of non-
U.S. citizens are limited to the extent that the shares of common stock held by such non-U.S. persons would otherwise be entitled to more than 24.9% of the
aggregate votes of all outstanding equity securities of US Airways Group. Holders of common stock have no right to cumulate their votes. Holders of
common stock participate equally as to any dividends or distributions on the common stock.
In May 2009, the Company completed a public offering of 17.5 million shares of common stock at an offering price of $3.97 per share. Net proceeds
from the offering, after underwriting discounts and commissions, were $66 million.
In September 2009, the Company completed a public offering of 29 million shares of common stock at an offering price of $4.75 per share. Net
proceeds from the offering, after underwriting discounts and commissions, were $137 million.
103