US Airways 2011 Annual Report Download - page 50
Download and view the complete annual report
Please find page 50 of the 2011 US Airways annual report below. You can navigate through the pages in the report by either clicking on the pages listed below, or by using the keyword search tool below to find specific information within the annual report.-
 1
1 -
2
-
3
-
4
-
5
-
6
-
7
-
8
-
9
-
10
-
11
-
12
-
13
-
14
-
15
-
16
-
17
-
18
-
19
-
20
-
21
-
22
-
23
-
24
-
25
-
26
-
27
-
28
-
29
-
30
-
31
-
32
-
33
-
34
-
35
-
36
-
37
-
38
-
39
-
 40
40 -
 41
41 -
 42
42 -
 43
43 -
 44
44 -
 45
45 -
 46
46 -
 47
47 -
 48
48 -
 49
49 -
 50
50 -
 51
51 -
 52
52 -
 53
53 -
 54
54 -
 55
55 -
 56
56 -
 57
57 -
 58
58 -
 59
59 -
 60
60 -
61
-
62
-
63
-
64
-
65
-
66
-
67
-
68
-
69
-
70
-
71
-
72
-
73
-
74
-
75
-
76
-
77
-
78
-
79
-
80
-
81
-
82
-
83
-
84
-
85
-
86
-
87
-
88
-
89
-
90
-
91
-
92
-
93
-
94
-
95
-
96
-
97
-
98
-
99
-
100
-
101
-
102
-
103
-
104
-
105
-
106
-
107
-
108
-
109
-
110
-
111
-
112
-
113
-
114
-
115
-
116
-
117
-
118
-
119
-
120
-
121
-
122
-
123
-
124
-
125
-
126
-
127
-
128
-
129
-
130
-
131
-
132
-
133
-
134
-
135
-
136
-
137
-
138
-
139
-
140
-
141
-
142
-
143
-
144
-
145
-
146
-
147
-
148
-
149
-
150
-
151
-
152
-
153
-
154
-
155
-
156
-
157
-
158
-
159
-
160
-
161
-
162
-
163
-
164
-
165
-
166
-
167
-
168
-
169
-
170
-
171
 |
 |
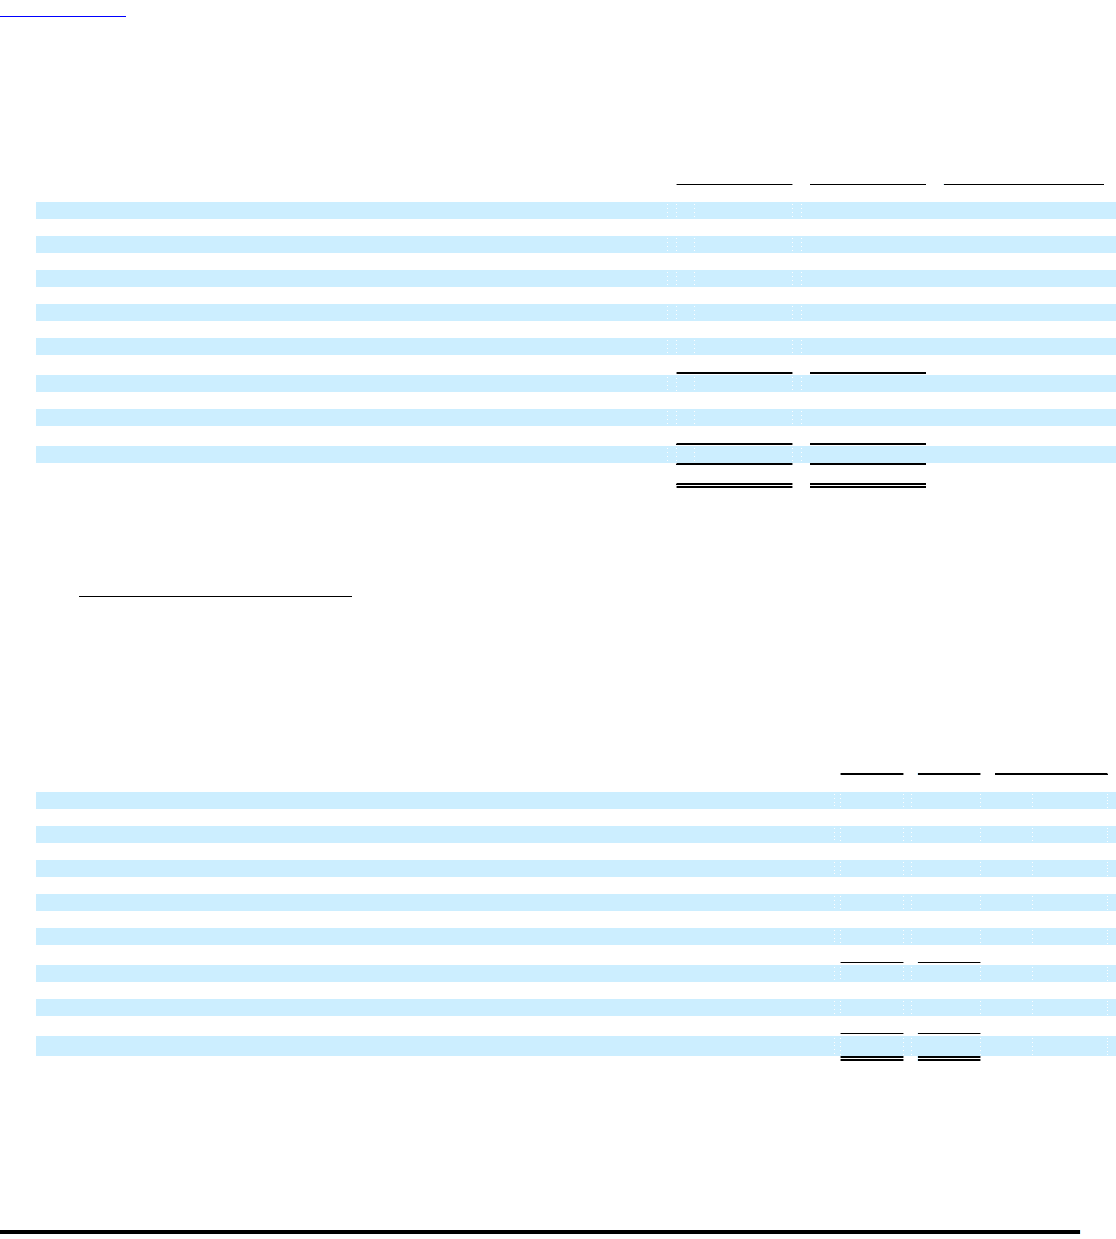
Table of Contents
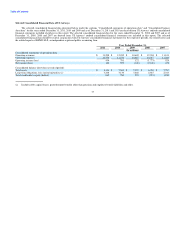
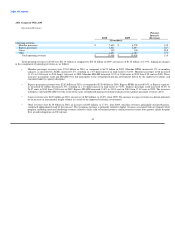
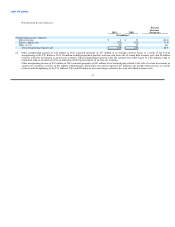
Operating Expenses:
Percent
Increase
2011 2010 (Decrease)
(In millions)
Operating expenses:
Aircraft fuel and related taxes $ 3,400 $ 2,403 41.4
Salaries and related costs 2,272 2,244 1.3
Aircraft rent 646 670 (3.6)
Aircraft maintenance 679 661 2.6
Other rent and landing fees 555 549 1.1
Selling expenses 454 421 7.7
Special items, net 24 5 nm
Depreciation and amortization 237 248 (4.5)
Other 1,235 1,197 3.2
Total mainline operating expenses 9,502 8,398 13.1
Express expenses:
Fuel 1,056 769 37.4
Other 2,071 1,960 5.6
Total Express expenses 3,127 2,729 14.6
Total operating expenses $ 12,629 $ 11,127 13.5
Total operating expenses were $12.63 billion in 2011, an increase of $1.50 billion, or 13.5%, compared to 2010. The 2011 increase in operating
expenses was driven by a $1.28 billion, or 40.5%, increase in mainline and Express fuel costs on a 1.0% increase in total system capacity. The average price
per gallon of fuel increased 38.2% to $3.11 in 2011 from $2.25 in 2010.
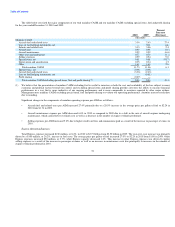
Mainline Operating Expenses per ASM:
Our mainline CASM increased 1.36 cents, or 11.6%, from 11.73 cents in 2010 to 13.09 cents in 2011. Excluding special items, fuel and profit sharing,
our mainline CASM increased 0.05 cents, or 0.6%, from 8.30 cents in 2010 to 8.35 cents in 2011, while mainline capacity increased 1.4%.
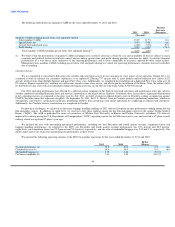
The table below sets forth the major components of our total mainline CASM and our mainline CASM excluding special items, fuel and profit sharing
for the years ended December 31, 2011 and 2010:
Percent
Increase
2011 2010 (Decrease)
(In cents)
Mainline CASM:
Aircraft fuel and related taxes 4.68 3.36 39.5
Salaries and related costs 3.13 3.13 —
Aircraft rent 0.89 0.93 (4.9)
Aircraft maintenance 0.94 0.92 1.2
Other rent and landing fees 0.76 0.77 (0.3)
Selling expenses 0.62 0.59 6.2
Special items, net 0.03 0.01 nm
Depreciation and amortization 0.33 0.35 (5.8)
Other 1.70 1.67 1.7
Total mainline CASM 13.09 11.73 11.6
Special items, net (0.03) (0.01)
Aircraft fuel and related taxes (4.68) (3.36)
Profit sharing (0.02) (0.07)
Total mainline CASM excluding special items, fuel and profit sharing (1) 8.35 8.30 0.6
(1) We believe that the presentation of mainline CASM excluding fuel is useful to investors as both the cost and availability of fuel are subject to many
economic and political factors beyond our control, and excluding special items and profit sharing provides investors the ability to measure financial
performance in a way that is more indicative of our ongoing performance and is more comparable to measures reported by other major airlines.
Management uses mainline CASM excluding special items, fuel and profit sharing to evaluate our operating performance. Amounts may not recalculate
due to rounding.
47