US Airways 2011 Annual Report Download - page 44
Download and view the complete annual report
Please find page 44 of the 2011 US Airways annual report below. You can navigate through the pages in the report by either clicking on the pages listed below, or by using the keyword search tool below to find specific information within the annual report.-
 1
1 -
2
-
3
-
4
-
5
-
6
-
7
-
8
-
9
-
10
-
11
-
12
-
13
-
14
-
15
-
16
-
17
-
18
-
19
-
20
-
21
-
22
-
23
-
24
-
25
-
26
-
27
-
28
-
29
-
30
-
31
-
32
-
33
-
 34
34 -
 35
35 -
 36
36 -
 37
37 -
 38
38 -
 39
39 -
 40
40 -
 41
41 -
 42
42 -
 43
43 -
 44
44 -
 45
45 -
 46
46 -
 47
47 -
 48
48 -
 49
49 -
 50
50 -
 51
51 -
 52
52 -
 53
53 -
 54
54 -
55
-
56
-
57
-
58
-
59
-
60
-
61
-
62
-
63
-
64
-
65
-
66
-
67
-
68
-
69
-
70
-
71
-
72
-
73
-
74
-
75
-
76
-
77
-
78
-
79
-
80
-
81
-
82
-
83
-
84
-
85
-
86
-
87
-
88
-
89
-
90
-
91
-
92
-
93
-
94
-
95
-
96
-
97
-
98
-
99
-
100
-
101
-
102
-
103
-
104
-
105
-
106
-
107
-
108
-
109
-
110
-
111
-
112
-
113
-
114
-
115
-
116
-
117
-
118
-
119
-
120
-
121
-
122
-
123
-
124
-
125
-
126
-
127
-
128
-
129
-
130
-
131
-
132
-
133
-
134
-
135
-
136
-
137
-
138
-
139
-
140
-
141
-
142
-
143
-
144
-
145
-
146
-
147
-
148
-
149
-
150
-
151
-
152
-
153
-
154
-
155
-
156
-
157
-
158
-
159
-
160
-
161
-
162
-
163
-
164
-
165
-
166
-
167
-
168
-
169
-
170
-
171
 |
 |
Table of Contents
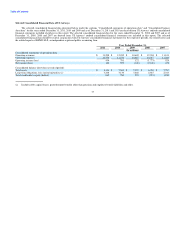
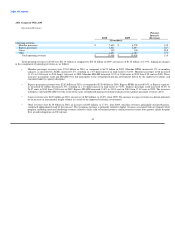
(a) Percentage of reported flight operations arriving on time as defined by the DOT.
(b) Percentage of scheduled flight operations completed.
(c) Rate of mishandled baggage reports per 1,000 passengers.
(d) Rate of customer complaints filed with the DOT per 100,000 passengers.
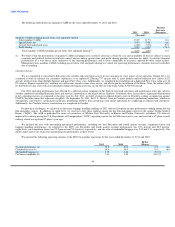
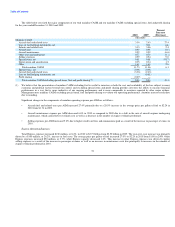
Liquidity Position
We maintained our liquidity position during 2011 despite extraordinarily high fuel costs. As of December 31, 2011, our total cash, cash equivalents,
investments in marketable securities and restricted cash was $2.31 billion, of which $365 million was restricted which was up slightly from $2.28 billion, of
which $364 million was restricted as of December 31, 2010.
December 31, December 31,
2011 2010
(In millions)
Cash and cash equivalents $ 1,947 $ 1,859
Long-term restricted cash 365 364
Investments in marketable securities — 57
Total cash, cash equivalents, investments in marketable securities and restricted cash $ 2,312 $ 2,280
Long-term restricted cash primarily includes cash collateral to secure workers' compensation claims and credit card processing holdback requirements
for advance ticket sales for which US Airways has not yet provided air transportation.
As of December 31, 2010, our investments in marketable securities included $57 million of auction rate securities. During 2011 these investments were
liquidated for proceeds of $52 million. See the notes to the consolidated financial statements included in Part II, Items 8A and 8B, respectively of this report
for additional information on these transactions.
2012 Outlook
Looking forward it is difficult to predict the price of oil, the strength of the economy or the capacity actions of other airlines. Over the past few years we
have taken significant actions to maintain capacity that is in line with demand, realign our network to focus on key markets, introduce new revenue streams,
control costs and continue our commitment to exceptional operating reliability. We intend to continue to maintain our cost and capacity discipline in light of
fuel prices, the state of the economy and general industry conditions.
41