US Airways 2011 Annual Report Download - page 79
Download and view the complete annual report
Please find page 79 of the 2011 US Airways annual report below. You can navigate through the pages in the report by either clicking on the pages listed below, or by using the keyword search tool below to find specific information within the annual report.-
 1
1 -
2
-
3
-
4
-
5
-
6
-
7
-
8
-
9
-
10
-
11
-
12
-
13
-
14
-
15
-
16
-
17
-
18
-
19
-
20
-
21
-
22
-
23
-
24
-
25
-
26
-
27
-
28
-
29
-
30
-
31
-
32
-
33
-
34
-
35
-
36
-
37
-
38
-
39
-
40
-
41
-
42
-
43
-
44
-
45
-
46
-
47
-
48
-
49
-
50
-
51
-
52
-
53
-
54
-
55
-
56
-
57
-
58
-
59
-
60
-
61
-
62
-
63
-
64
-
65
-
66
-
67
-
68
-
 69
69 -
 70
70 -
 71
71 -
 72
72 -
 73
73 -
 74
74 -
 75
75 -
 76
76 -
 77
77 -
 78
78 -
 79
79 -
 80
80 -
 81
81 -
 82
82 -
 83
83 -
 84
84 -
 85
85 -
 86
86 -
 87
87 -
 88
88 -
 89
89 -
90
-
91
-
92
-
93
-
94
-
95
-
96
-
97
-
98
-
99
-
100
-
101
-
102
-
103
-
104
-
105
-
106
-
107
-
108
-
109
-
110
-
111
-
112
-
113
-
114
-
115
-
116
-
117
-
118
-
119
-
120
-
121
-
122
-
123
-
124
-
125
-
126
-
127
-
128
-
129
-
130
-
131
-
132
-
133
-
134
-
135
-
136
-
137
-
138
-
139
-
140
-
141
-
142
-
143
-
144
-
145
-
146
-
147
-
148
-
149
-
150
-
151
-
152
-
153
-
154
-
155
-
156
-
157
-
158
-
159
-
160
-
161
-
162
-
163
-
164
-
165
-
166
-
167
-
168
-
169
-
170
-
171
 |
 |
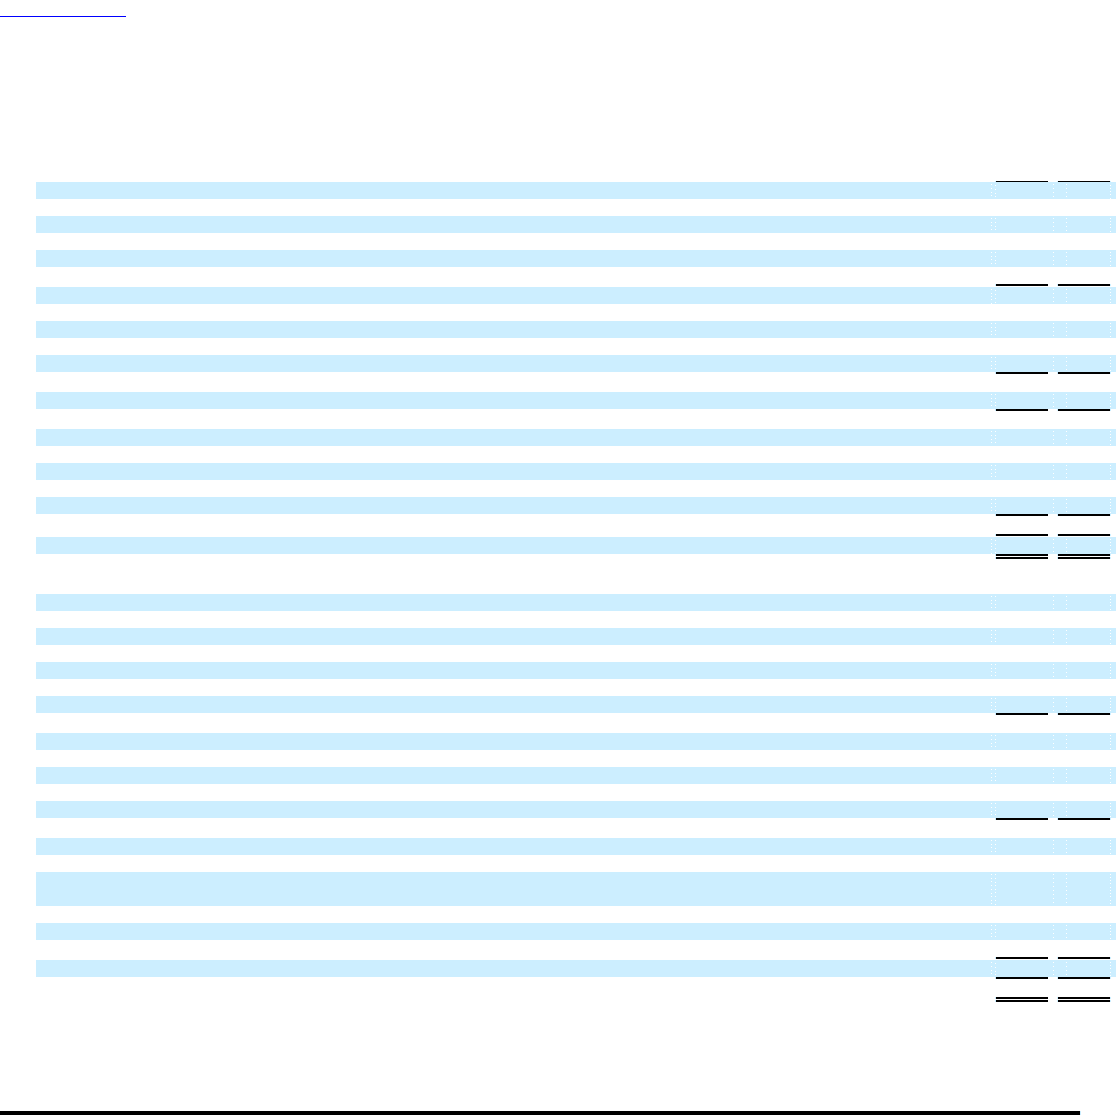
Table of Contents
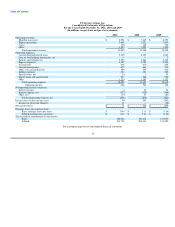
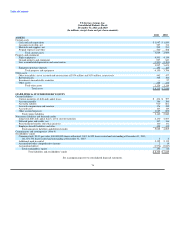
US Airways Group, Inc.
Consolidated Balance Sheets
December 31, 2011 and 2010
(In millions, except share and per share amounts)
2011 2010
ASSETS
Current assets
Cash and cash equivalents $ 1,947 $ 1,859
Accounts receivable, net 327 311
Materials and supplies, net 235 231
Prepaid expenses and other 540 508
Total current assets 3,049 2,909
Property and equipment
Flight equipment 4,591 4,134
Ground property and equipment 907 843
Less accumulated depreciation and amortization (1,501) (1,304)
3,997 3,673
Equipment purchase deposits 153 123
Total property and equipment 4,150 3,796
Other assets
Other intangibles, net of accumulated amortization of $134 million and $139 million, respectively 543 477
Restricted cash 365 364
Investments in marketable securities — 57
Other assets 228 216
Total other assets 1,136 1,114
Total assets $ 8,335 $ 7,819
LIABILITIES & STOCKHOLDERS' EQUITY
Current liabilities
Current maturities of debt and capital leases $ 436 $ 397
Accounts payable 386 386
Air traffic liability 910 861
Accrued compensation and vacation 176 245
Accrued taxes 163 149
Other accrued expenses 1,089 802
Total current liabilities 3,160 2,840
Noncurrent liabilities and deferred credits
Long-term debt and capital leases, net of current maturities 4,130 4,003
Deferred gains and credits, net 307 336
Postretirement benefits other than pensions 160 141
Employee benefit liabilities and other 428 415
Total noncurrent liabilities and deferred credits 5,025 4,895
Commitments and contingencies (Note 9)
Stockholders' equity
Common stock, $0.01 par value; 400,000,000 shares authorized, 162,116,902 shares issued and outstanding at December 31, 2011;
161,874,756 shares issued and outstanding at December 31, 2010 2 2
Additional paid-in capital 2,122 2,115
Accumulated other comprehensive income 2 14
Accumulated deficit (1,976) (2,047)
Total stockholders' equity 150 84
Total liabilities and stockholders' equity $ 8,335 $ 7,819
See accompanying notes to consolidated financial statements.
76